
GTS turns logged engine data into accurate, evidence-based tuning across fuel, compensation, boost, knock and ignition — by mapping every datapoint to the table cell that produced it. Here’s how that works in each area.
Fuel
The heart of GTS. Every datapoint in each log has its fuel requirement to hit target AFR calculated and is mapped to the row and column it represents in the VE table. Intelligent processing ensures you’re looking at real cell values — not noisy instantaneous readings.
- Interactive VE table editor with an optional 3D surface view
- Per-column and per-row scatter plots showing exactly what the engine requires from real world data
- Drag points on the graph, type values numerically, or nudge with keyboard hotkeys to adjust the table
- Intelligent quality rating filters out noisy or unreliable datapoints automatically
- Plot volumetric efficiency against RPM to align your table columns with the engine’s natural resonant peaks and troughs — something real-time tuning can’t see
Columns
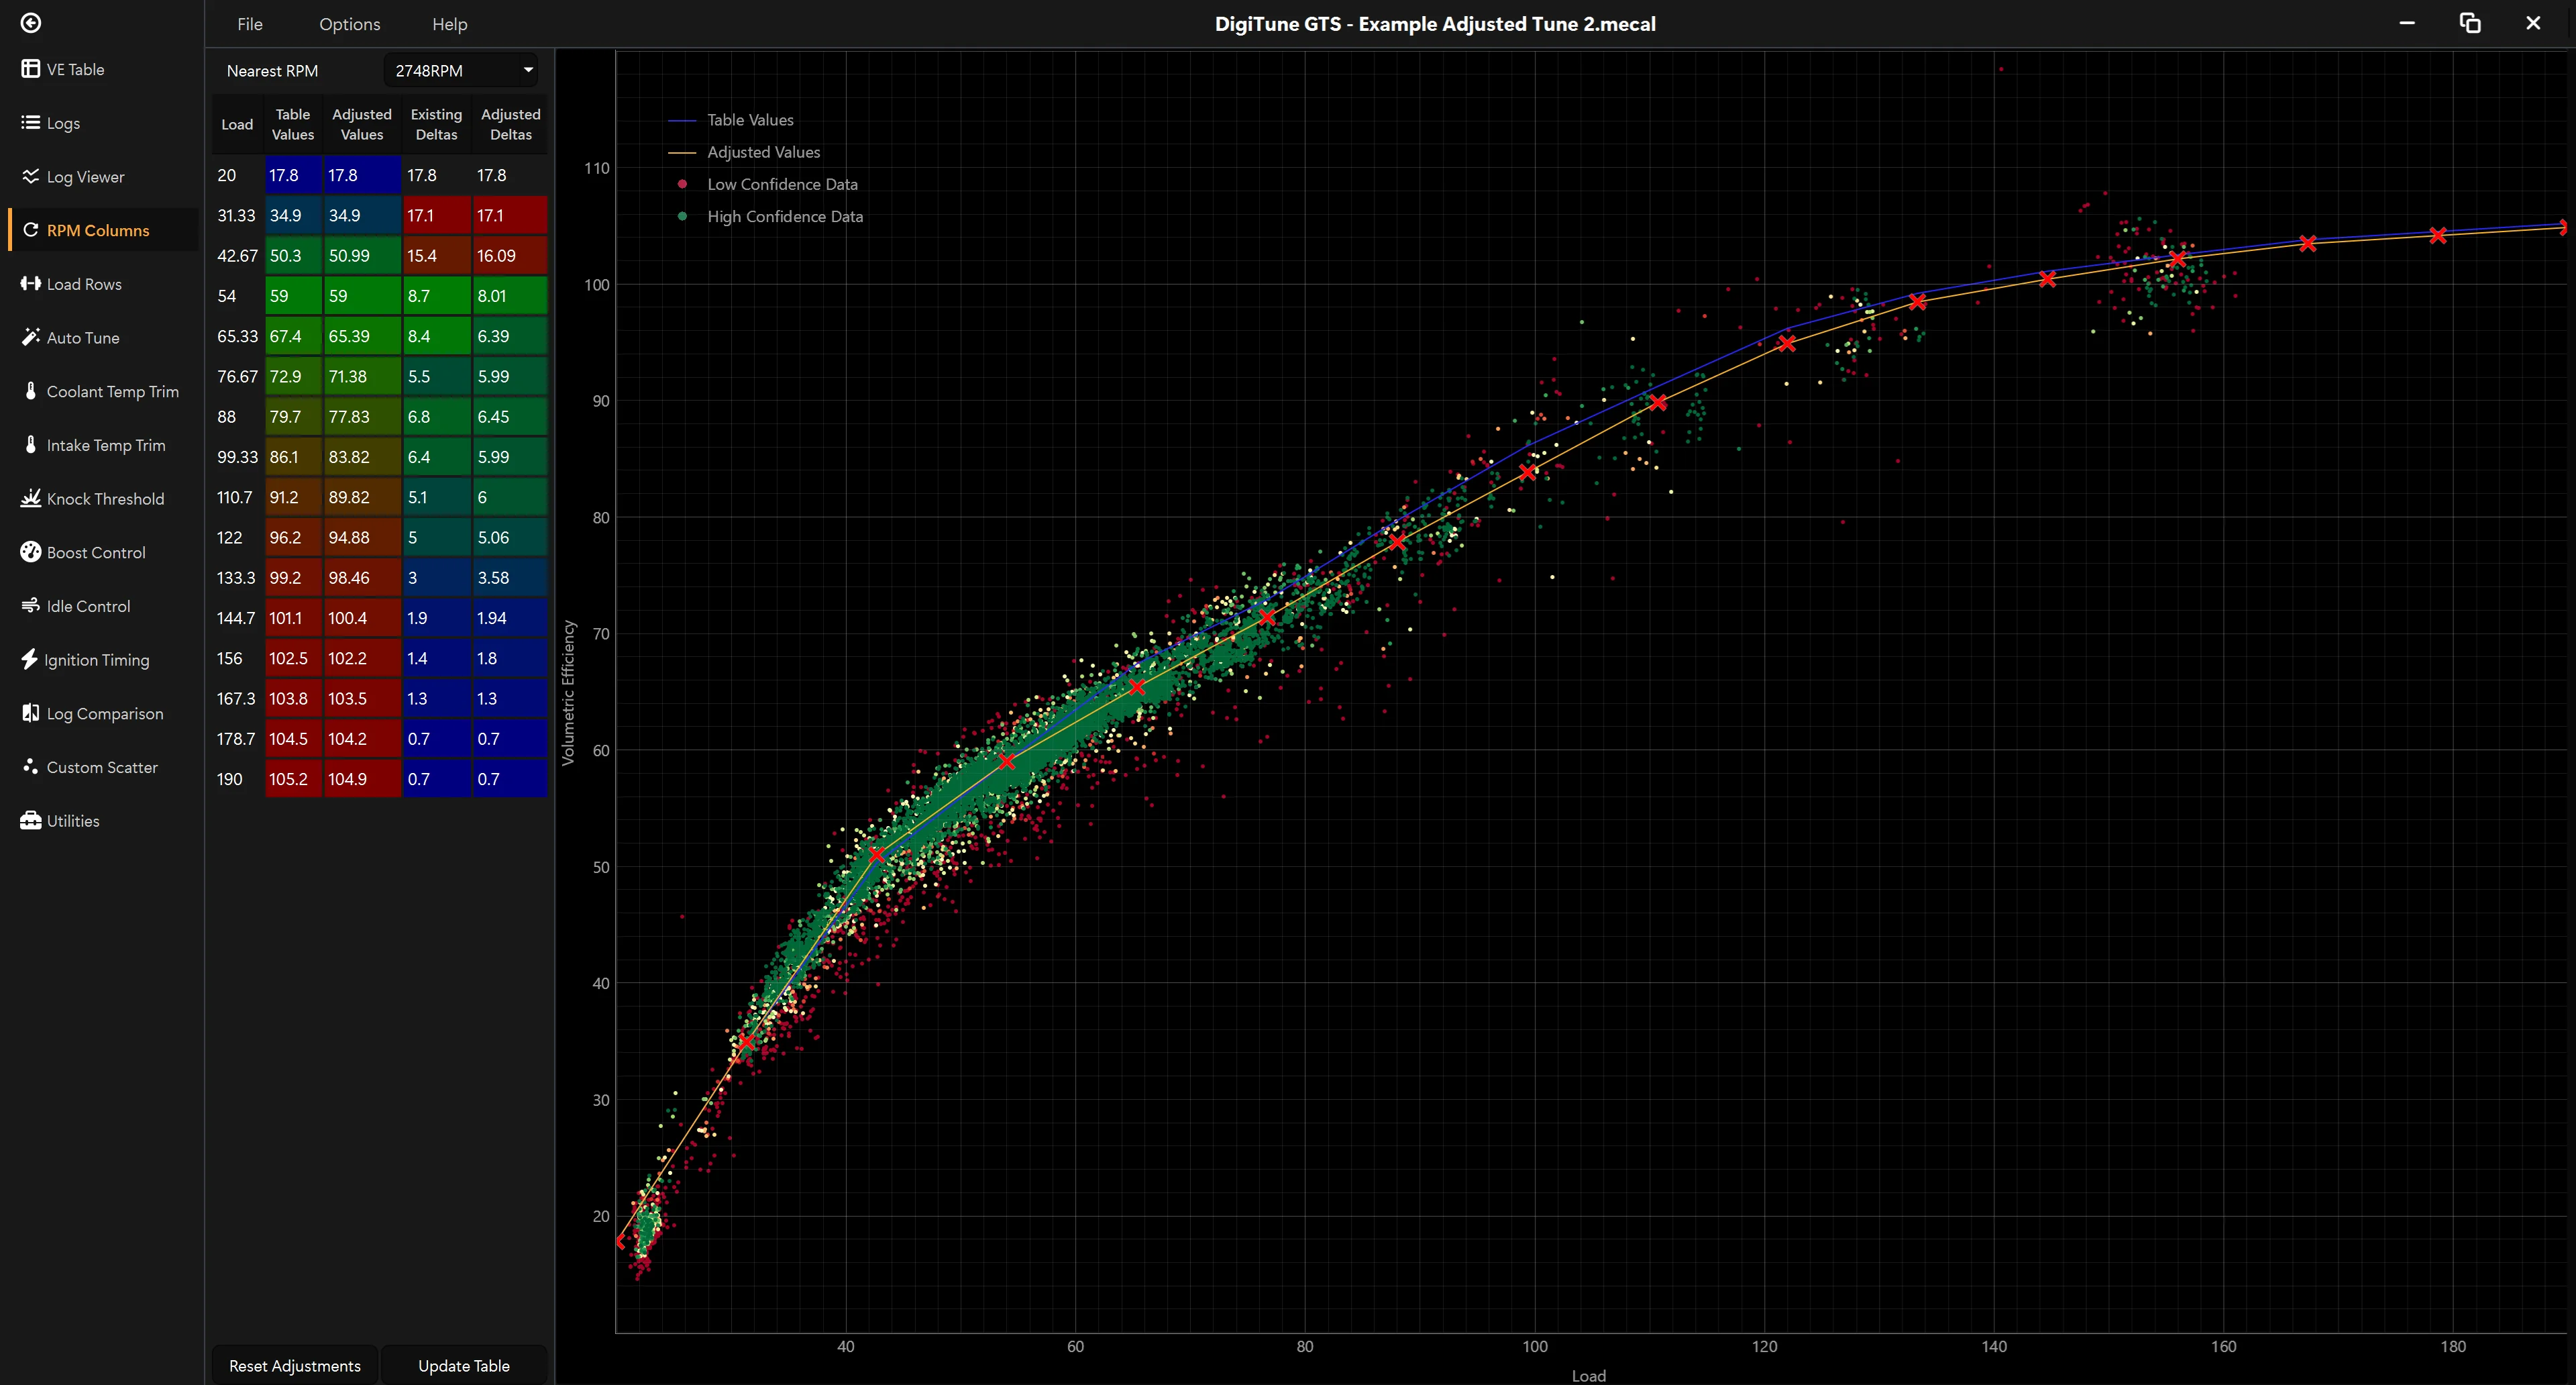
One scatter plot per column of the VE table — every log datapoint that landed nearest to that RPM column plotted against load, with a fitted line you drag, type or nudge to commit the values for that column. Differences between data point RPM and column RPM are automatically compensated for.
Rows
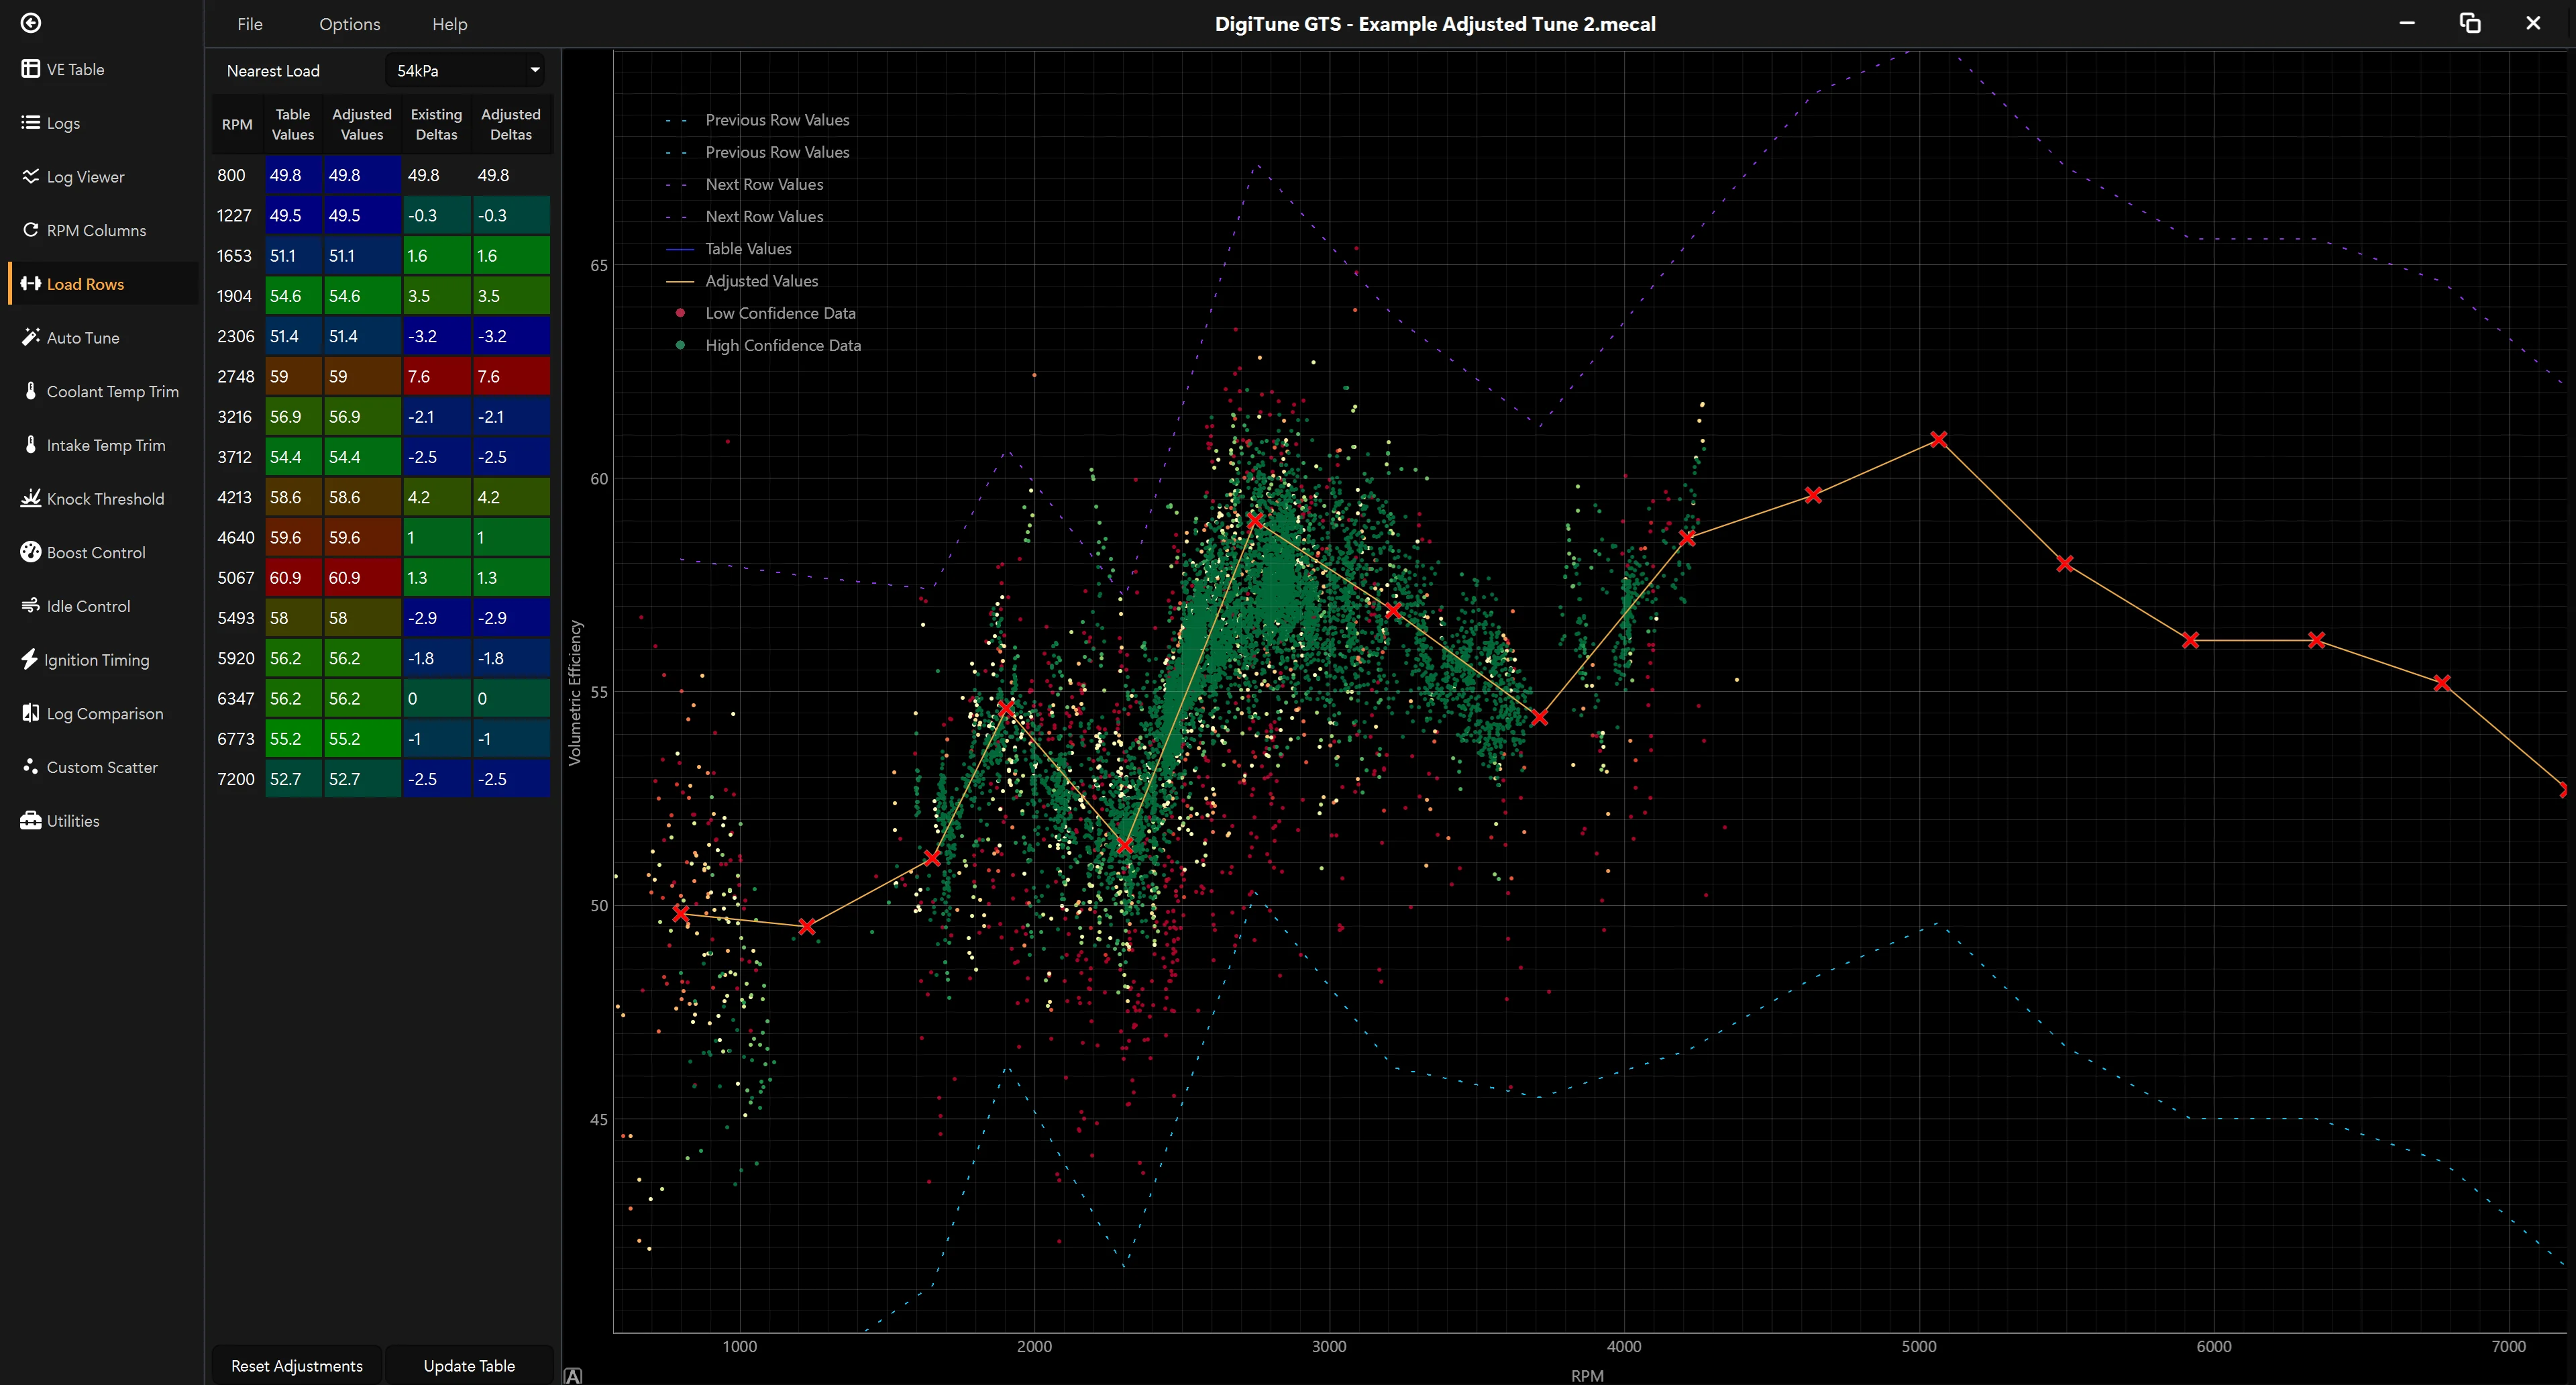
Same data, different cut: one scatter plot per row instead of per column. Useful for spotting trends across the load axis and aligning row breakpoints with the engine’s actual behavior. Differences between data point load and row load are automatically compensated for.
AutoTune
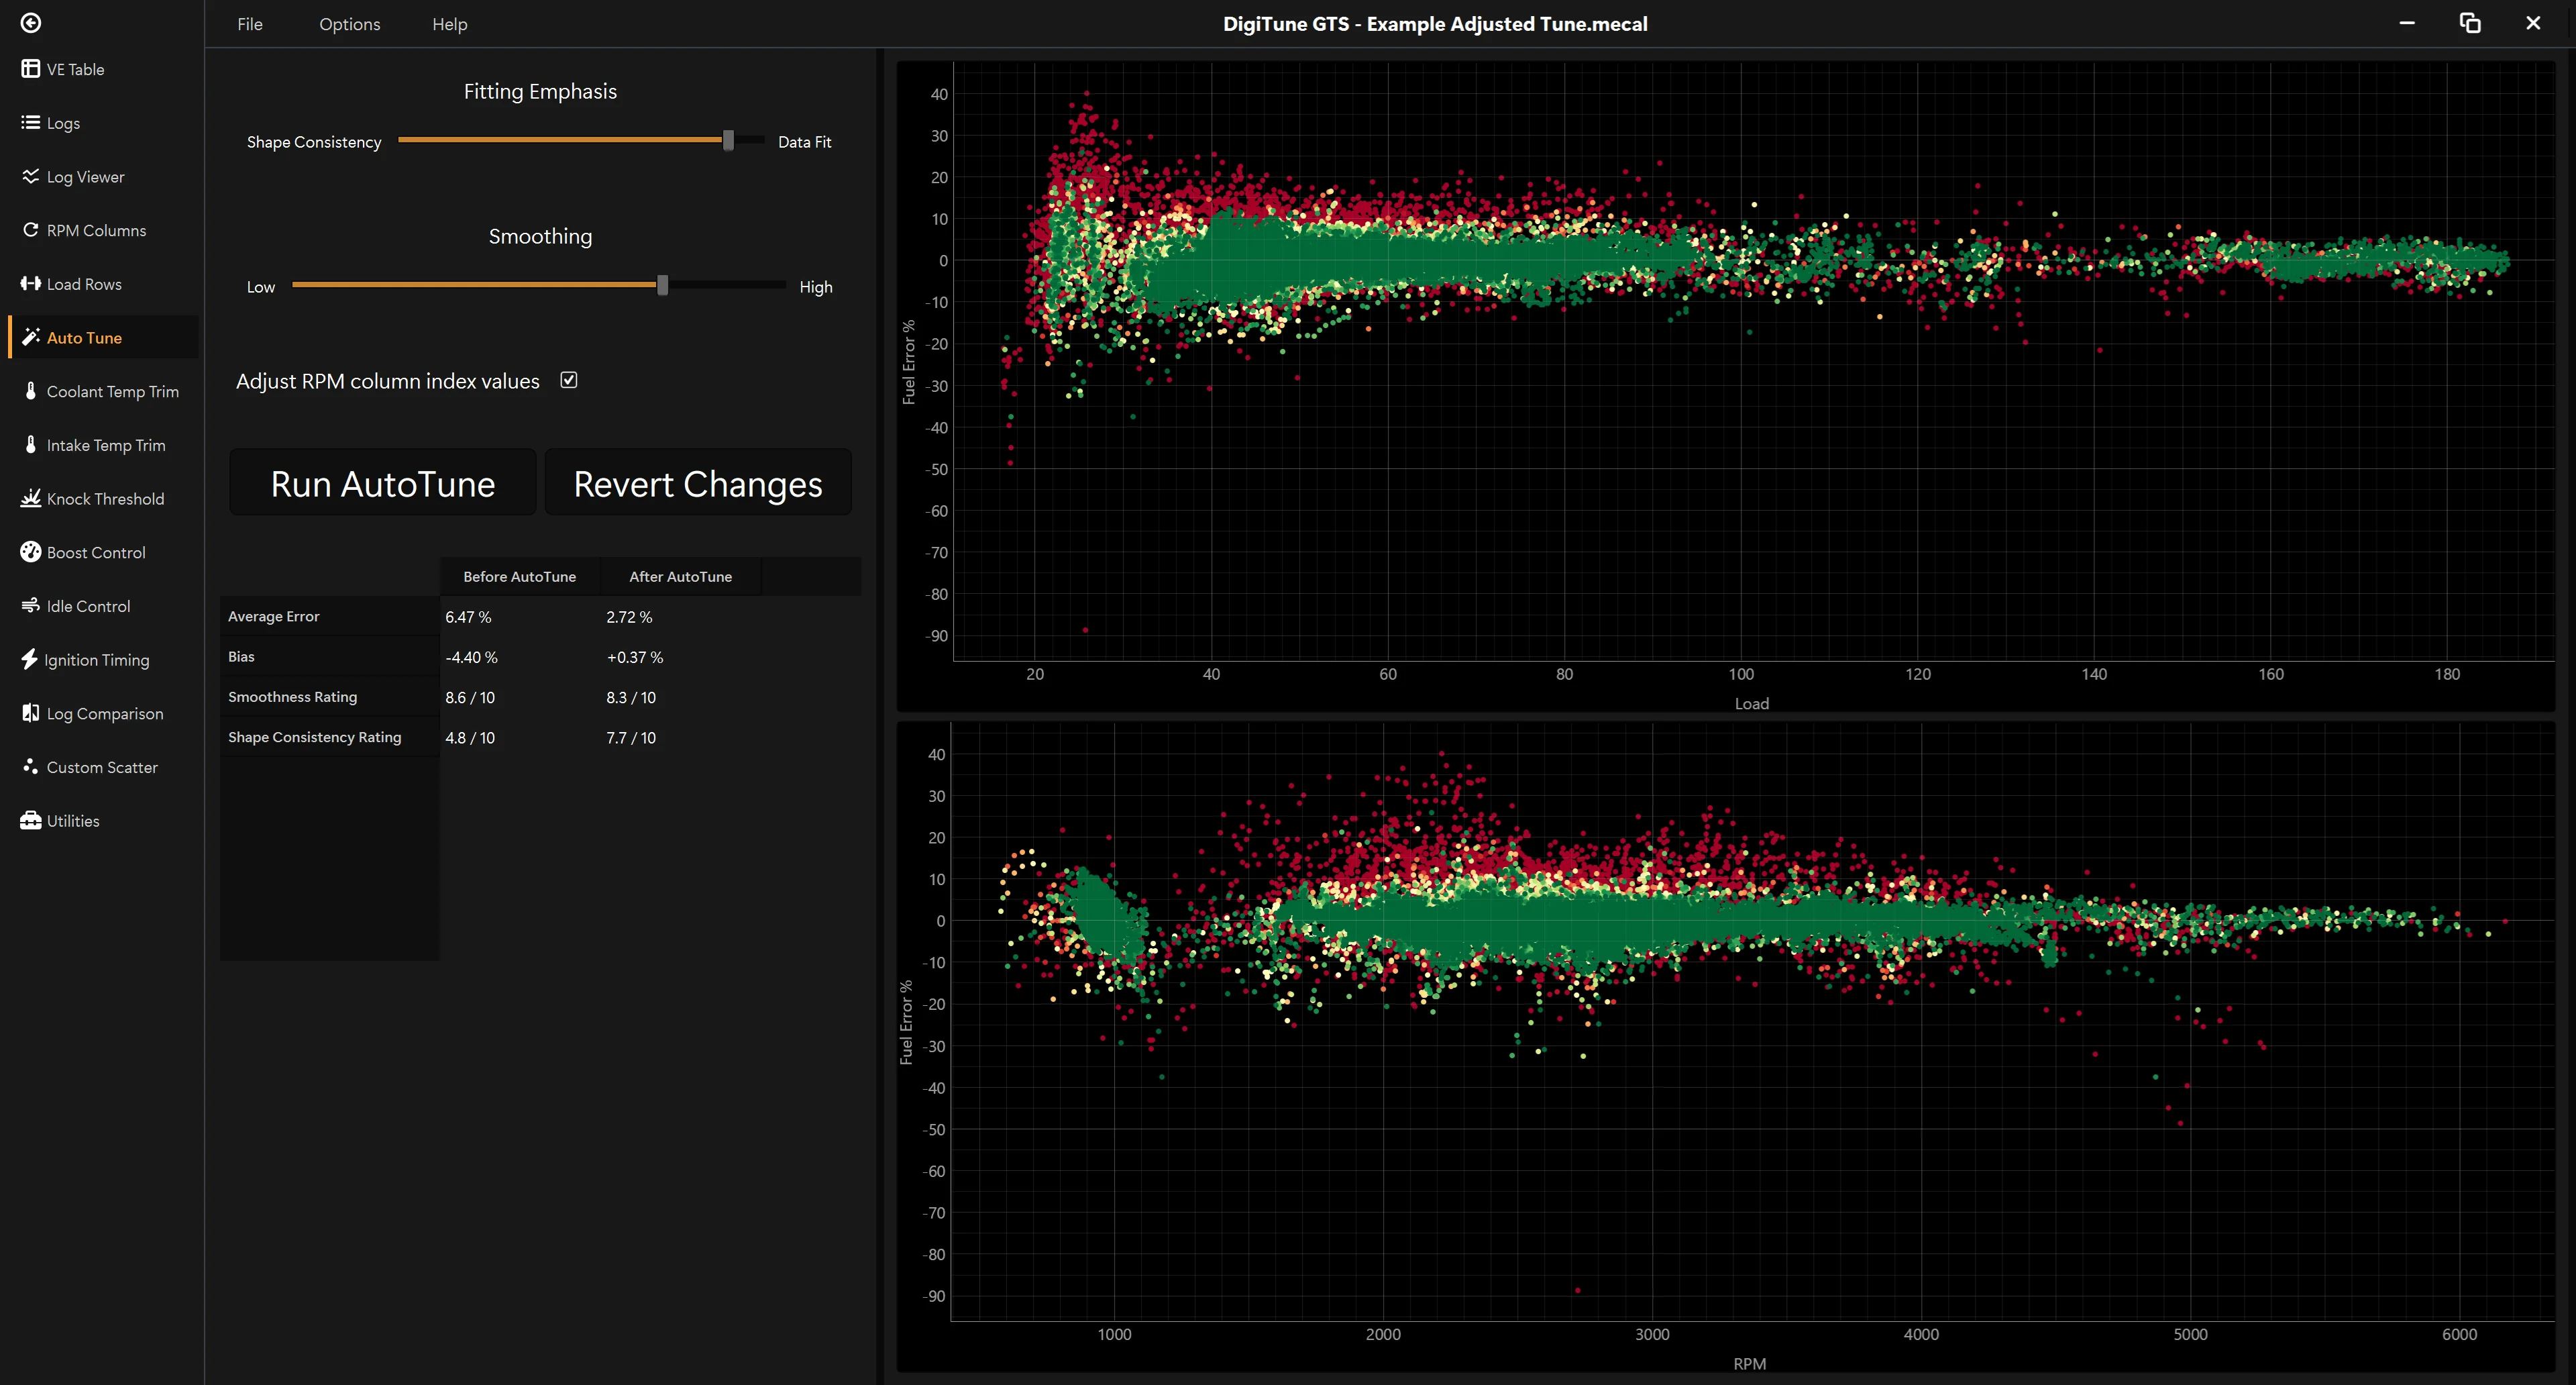
One-click auto-tune with full smoothing and quality controls. AutoTune writes a proposed set of cell values from your logs; you review and tweak it in the Columns/Rows views before saving.
Log viewer
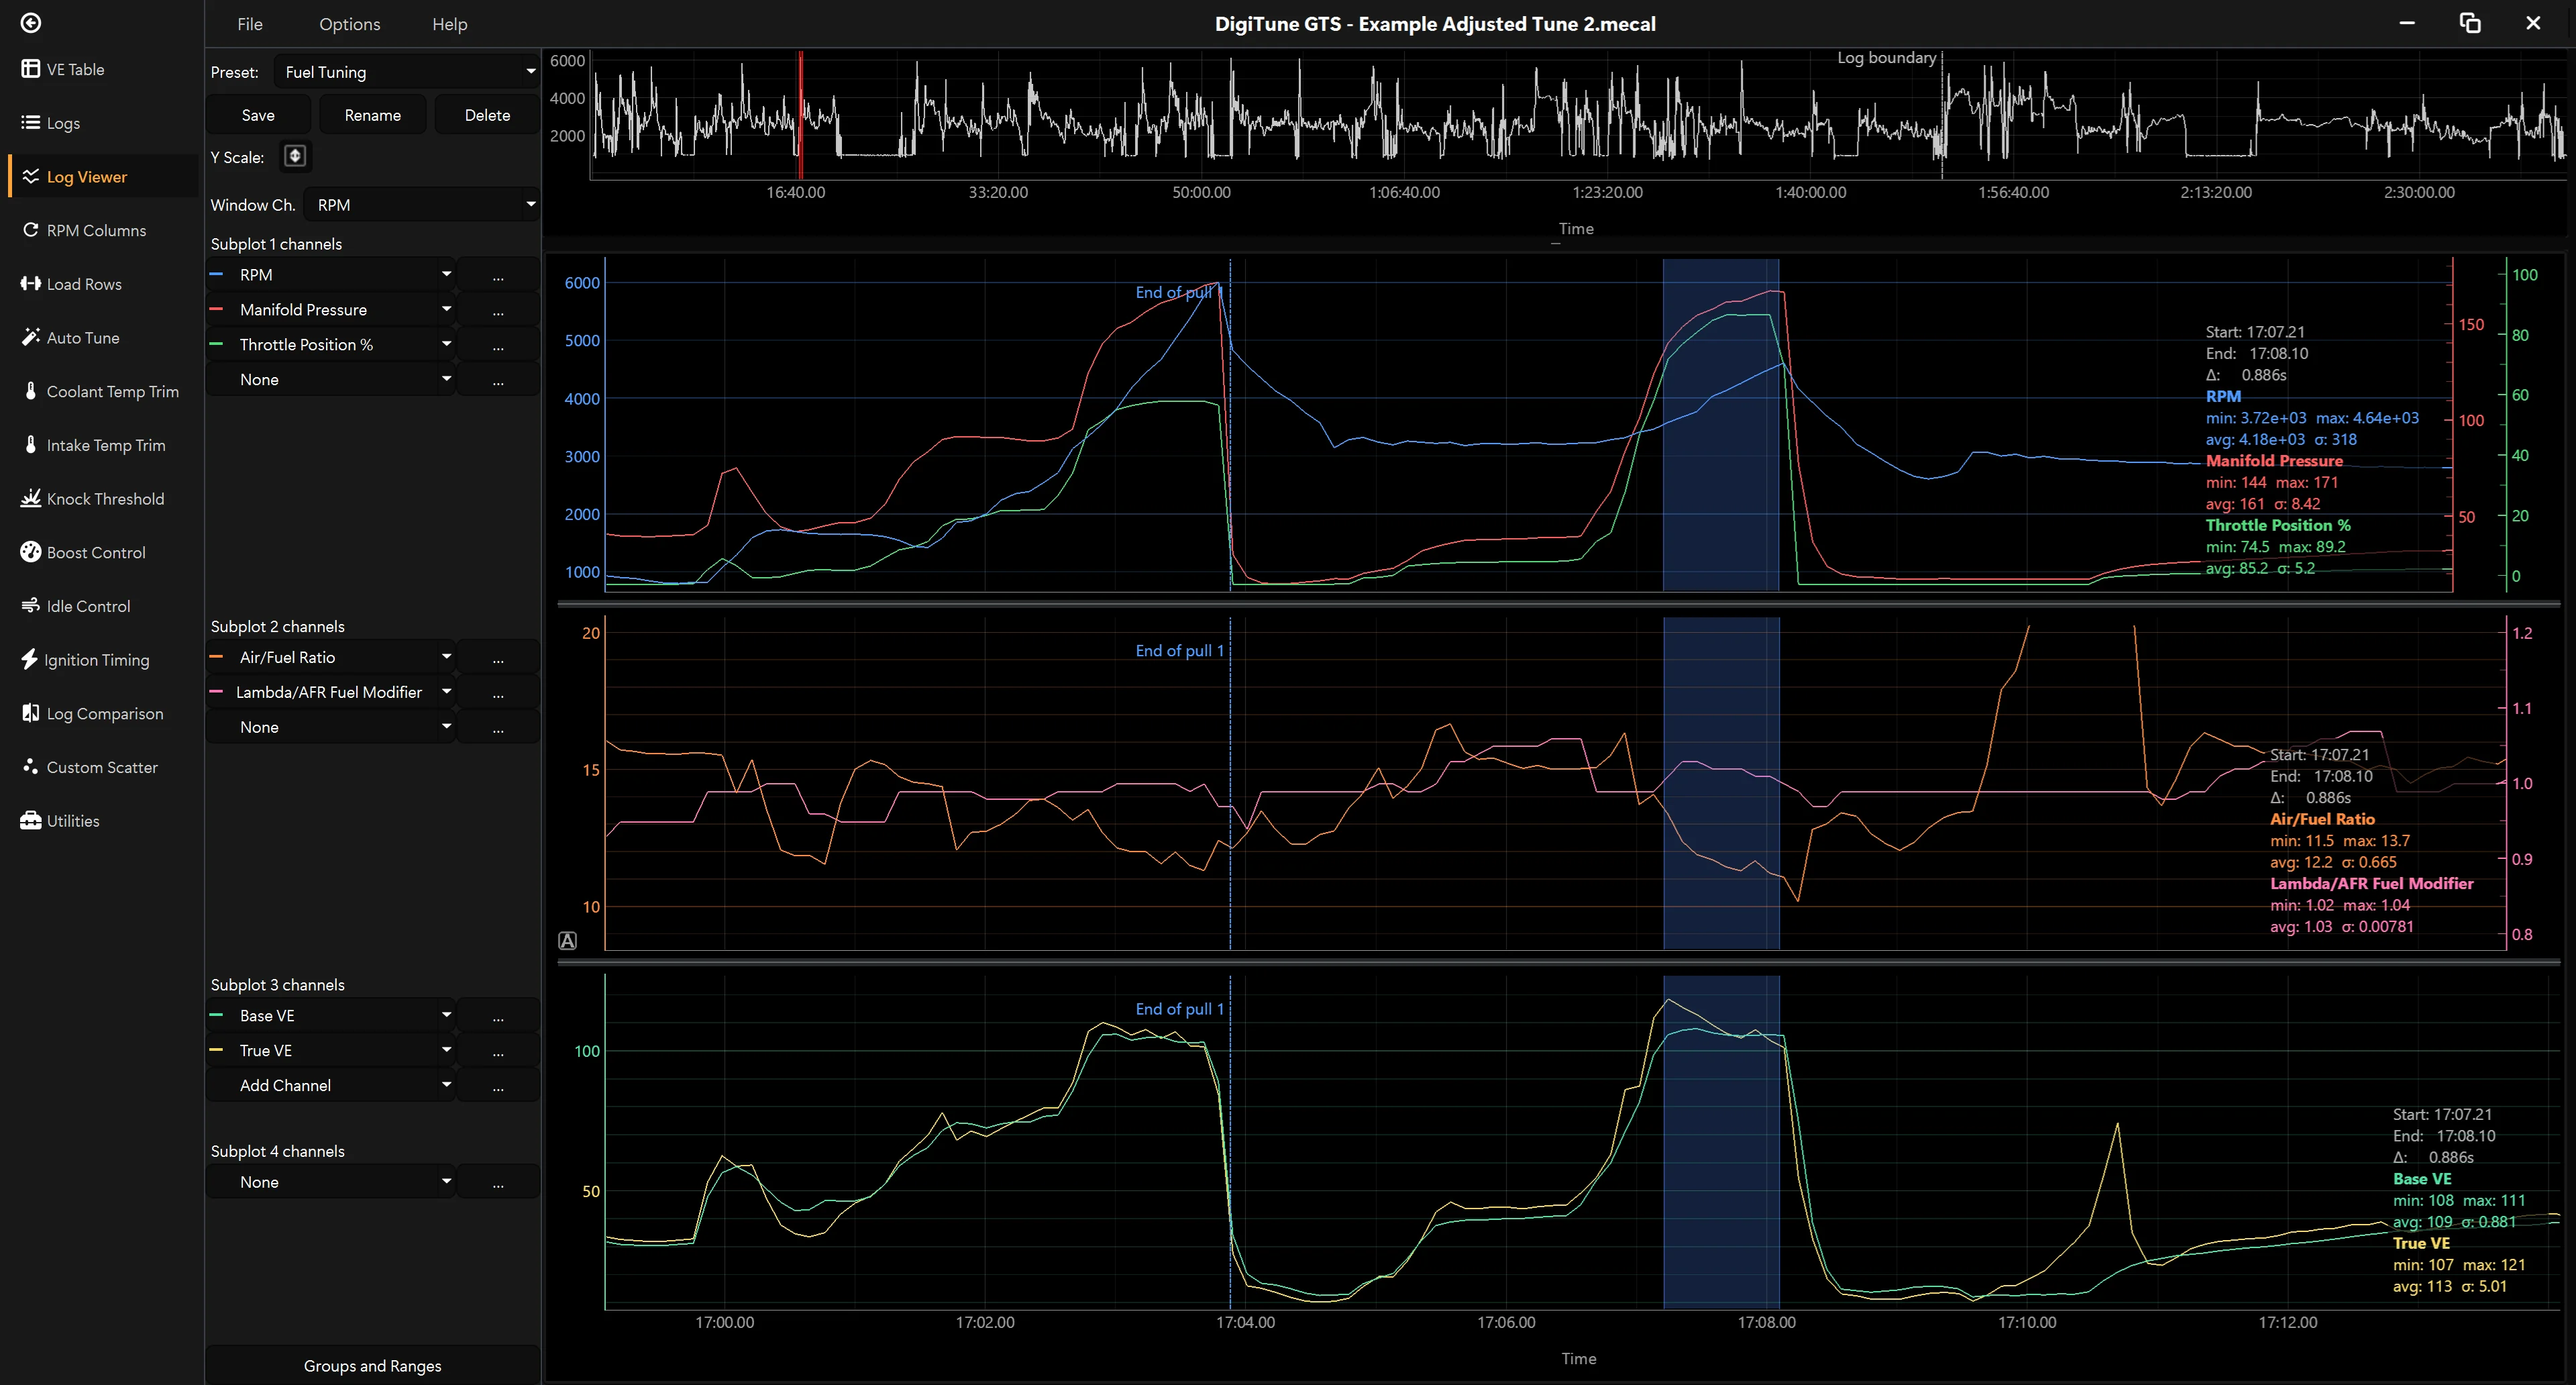
The investigator. Ctrl + click on any point in any scatter, and you’ll automatically be taken to that point in the time based log viewer with selectable channels and presets for common analysis tasks.
- Time-series viewer with zoom, pan and channel selection
- Multi-log merge into a single timeline
- Per-channel Y axes — RPM and AFR don’t get squashed onto the same scale
- Default channel preset packs for each ECU, plus your own saved sets
- Ctrl+Click on any scatter plot point to jump to that exact moment in the log viewer
Trims / Compensation
Load warmup logs or multiple sessions from different conditions. GTS combines them and shows how intake air and coolant temperatures actually affect your tune.
- IAT (intake air temperature) trim analysis across multiple logs
- CLT (coolant temperature) trim analysis
- A/B comparison view between any two logs
Boost & idle
- Open-loop and closed-loop / target boost tables
- Boost duty and idle duty scatter plots driven by logged data
- Replace trial-and-error with measurement
Knock & timing
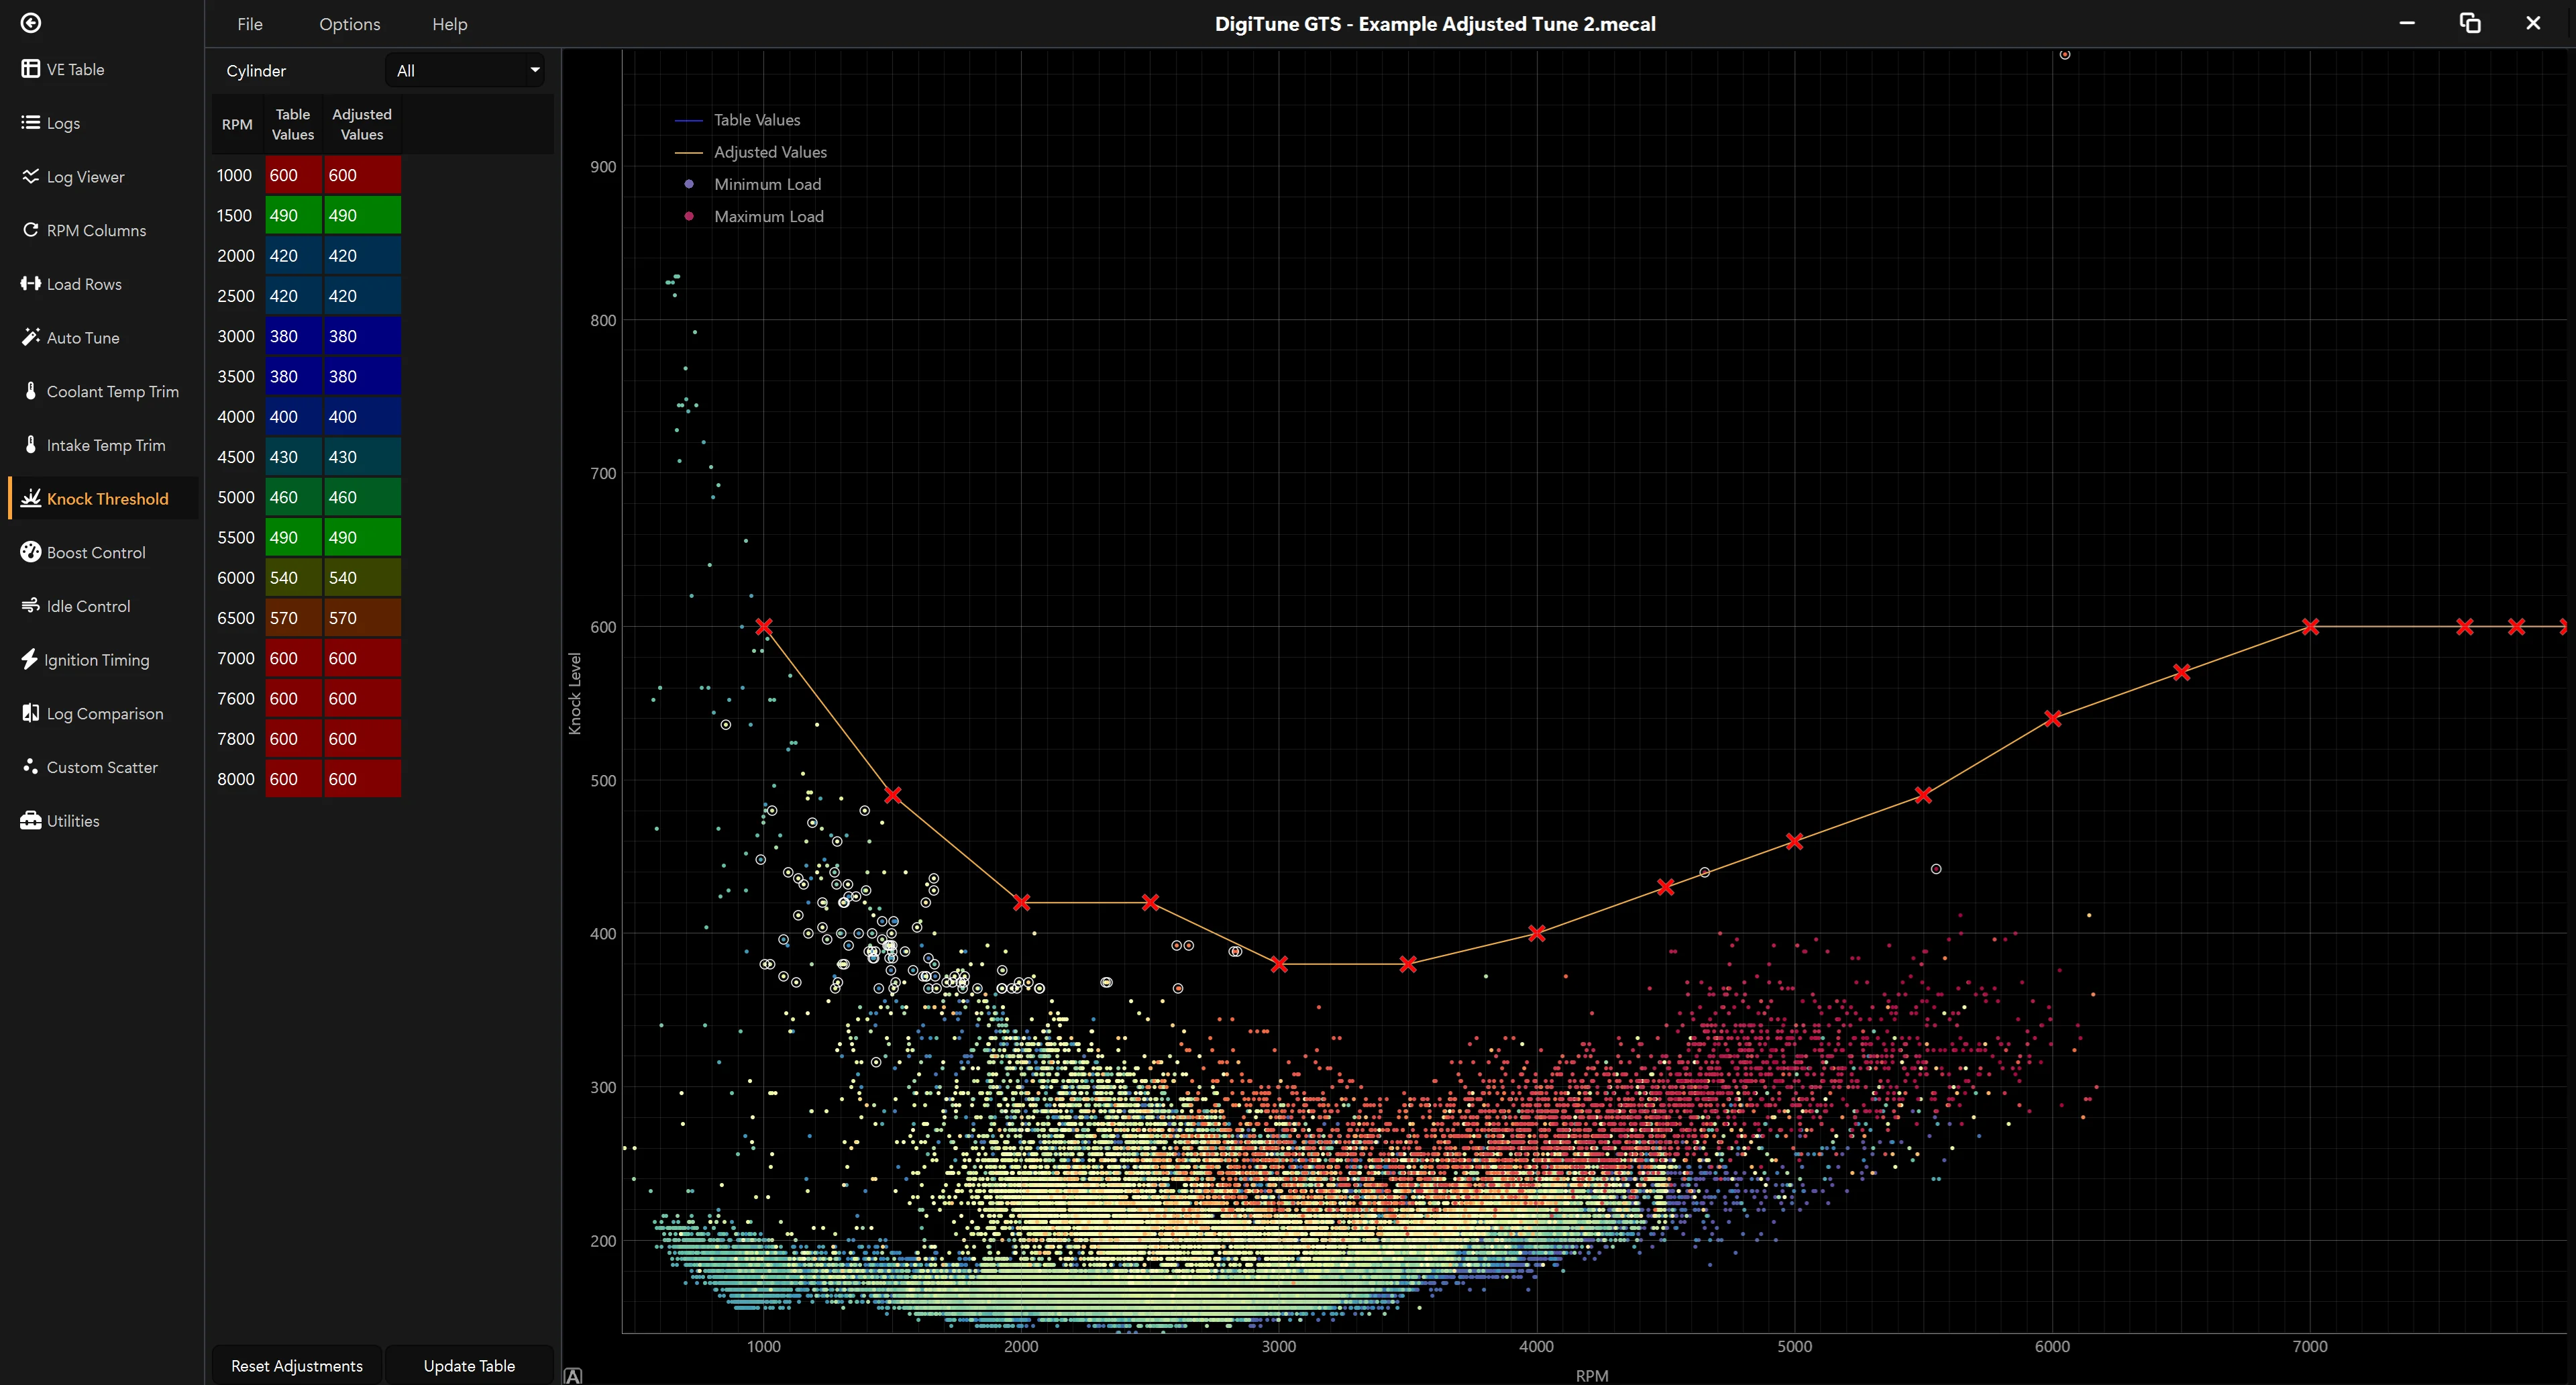
Two pages, one workflow. Start on the knock page to make sure the ECU only reacts to real knock events; then move to the ignition page to apply retard where needed and bake that into your tune.
On the knock page
- Raw knock sensor signal plotted against RPM
- ECU-detected knock events highlighted on the plot
- Background Noise and Acceptable Level thresholds overlaid for direct adjustment
- Set thresholds based on what your engine actually does, not guesswork
On the ignition page
- Ignition table editor with knock retard overlay on every cell
- See where the ECU pulled timing during a log, and bake that into the table with configurable retard amount per event
- Move from reactive to proactive protection