Fuel / VE Tuning
Manual fuel table editing using RPM Column, Load Row, and Global pages
The fuel tuning pages show your measured fuel data plotted against the current VE table values, letting you see exactly where the table is lean or rich and by how much. Every page follows the same pattern: a scatter graph on the right and an editable table on the left. Changes made in the table are immediately reflected in the graph.
Data quality colouring
Every scatter point is coloured on a green–yellow–red scale:
- Green — high-quality, steady-state data. Trustworthy for table changes.
- Yellow/amber — moderate quality. Use with caution.
- Red — low quality (transient throttle, cold engine, startup blanking period). Treat as noise.
Quality is determined by throttle movement rate, MAP stability, coolant temperature, and time since engine start. You can adjust all thresholds in Settings.
RPM Column page
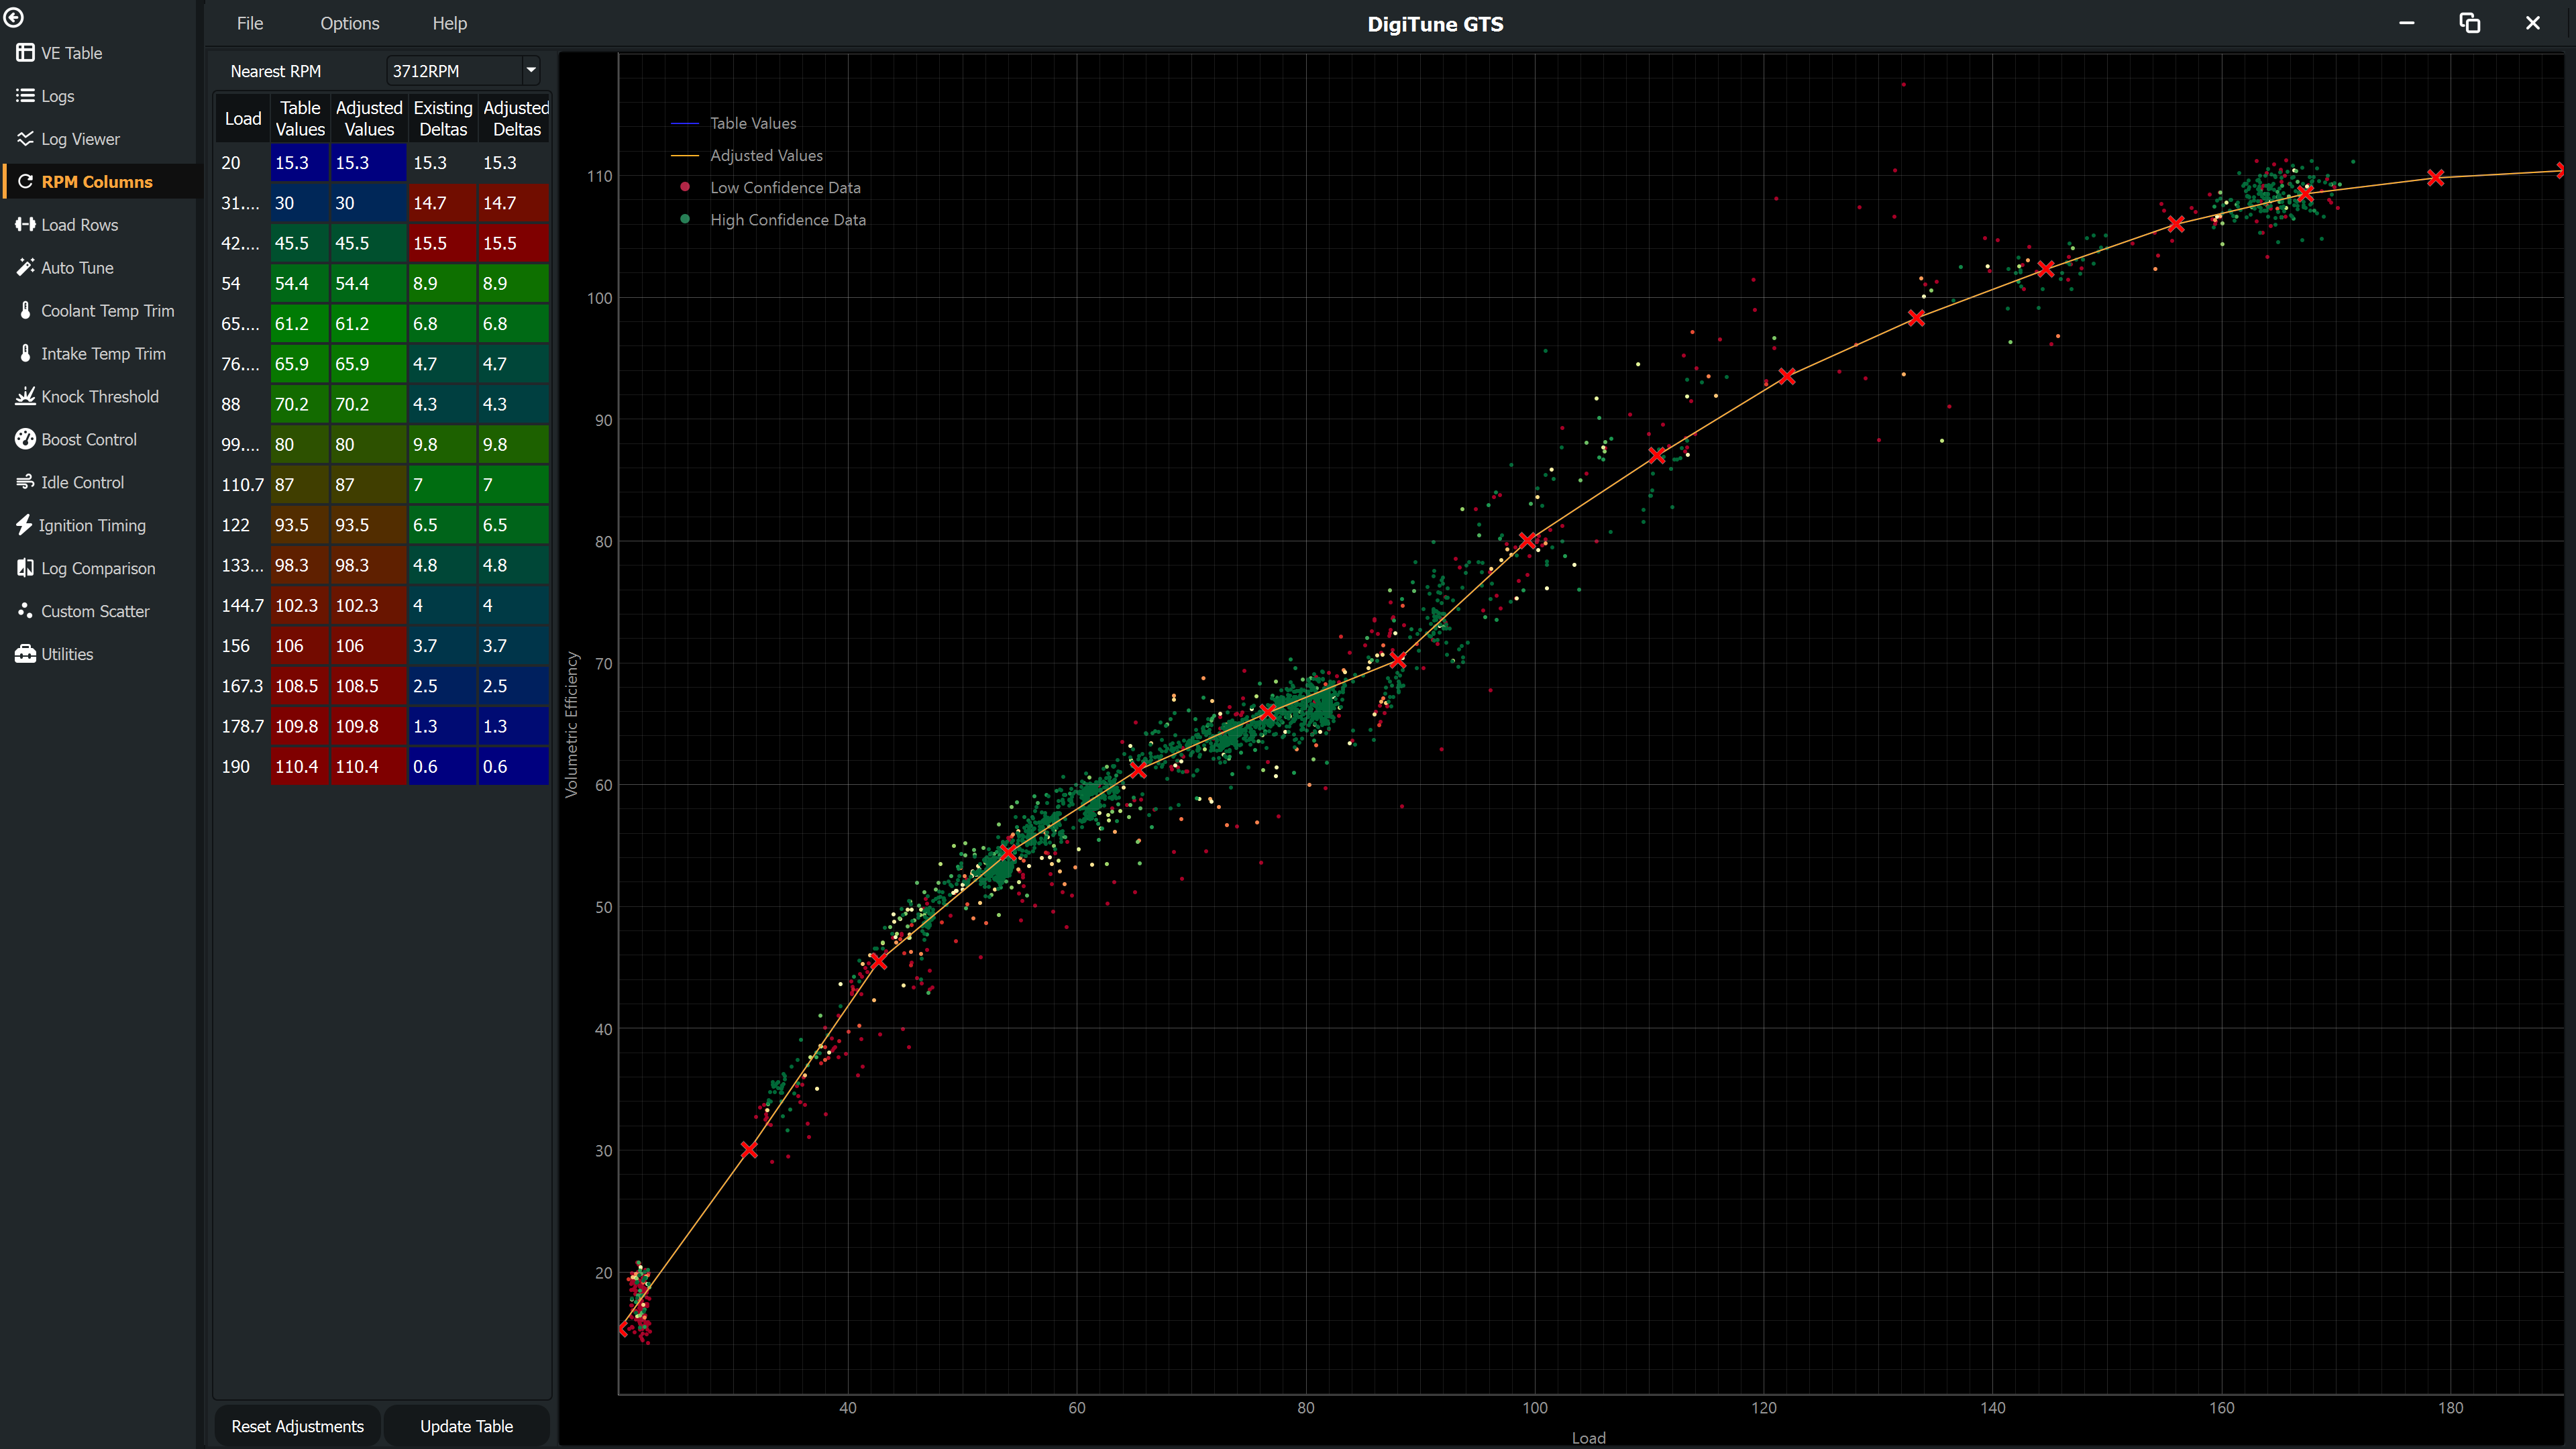
The RPM Column page lets you inspect and adjust one column (one RPM breakpoint) of the VE table at a time. The X axis of the graph is Load (kPa or %TPS); the Y axis is VE. The solid line shows current table values; scatter points show what the data says the VE should be at each load point.
Table columns
| Column | Description |
|---|---|
| Load | Load axis breakpoints for this table row. |
| Table Values | Current values in the map file (before any adjustments). |
| Adjusted Values | Your pending changes. Edit these cells to change the table. Initially matches Table Values. |
| Existing Deltas | The delta already present between adjacent rows before your session. |
| Adjusted Deltas | The delta between adjacent rows with your Adjusted Values applied — useful for spotting unrealistic jumps. |
How to use
- Select an RPM value from the dropdown at the top of the page.
- Inspect the graph. Points well above the solid line mean the engine is running lean at that load — the VE value needs to increase. Points below mean it is running rich.
- Click cells in the Adjusted Values column to select them, then use keyboard shortcuts to increment, decrement, interpolate, or type a value directly.
- When satisfied, click Update to write the adjusted values to the in-memory map. The scatter graph redraws to reflect the new table line.
- Click Reset to discard all pending adjustments and revert to the original values.
Load Row page
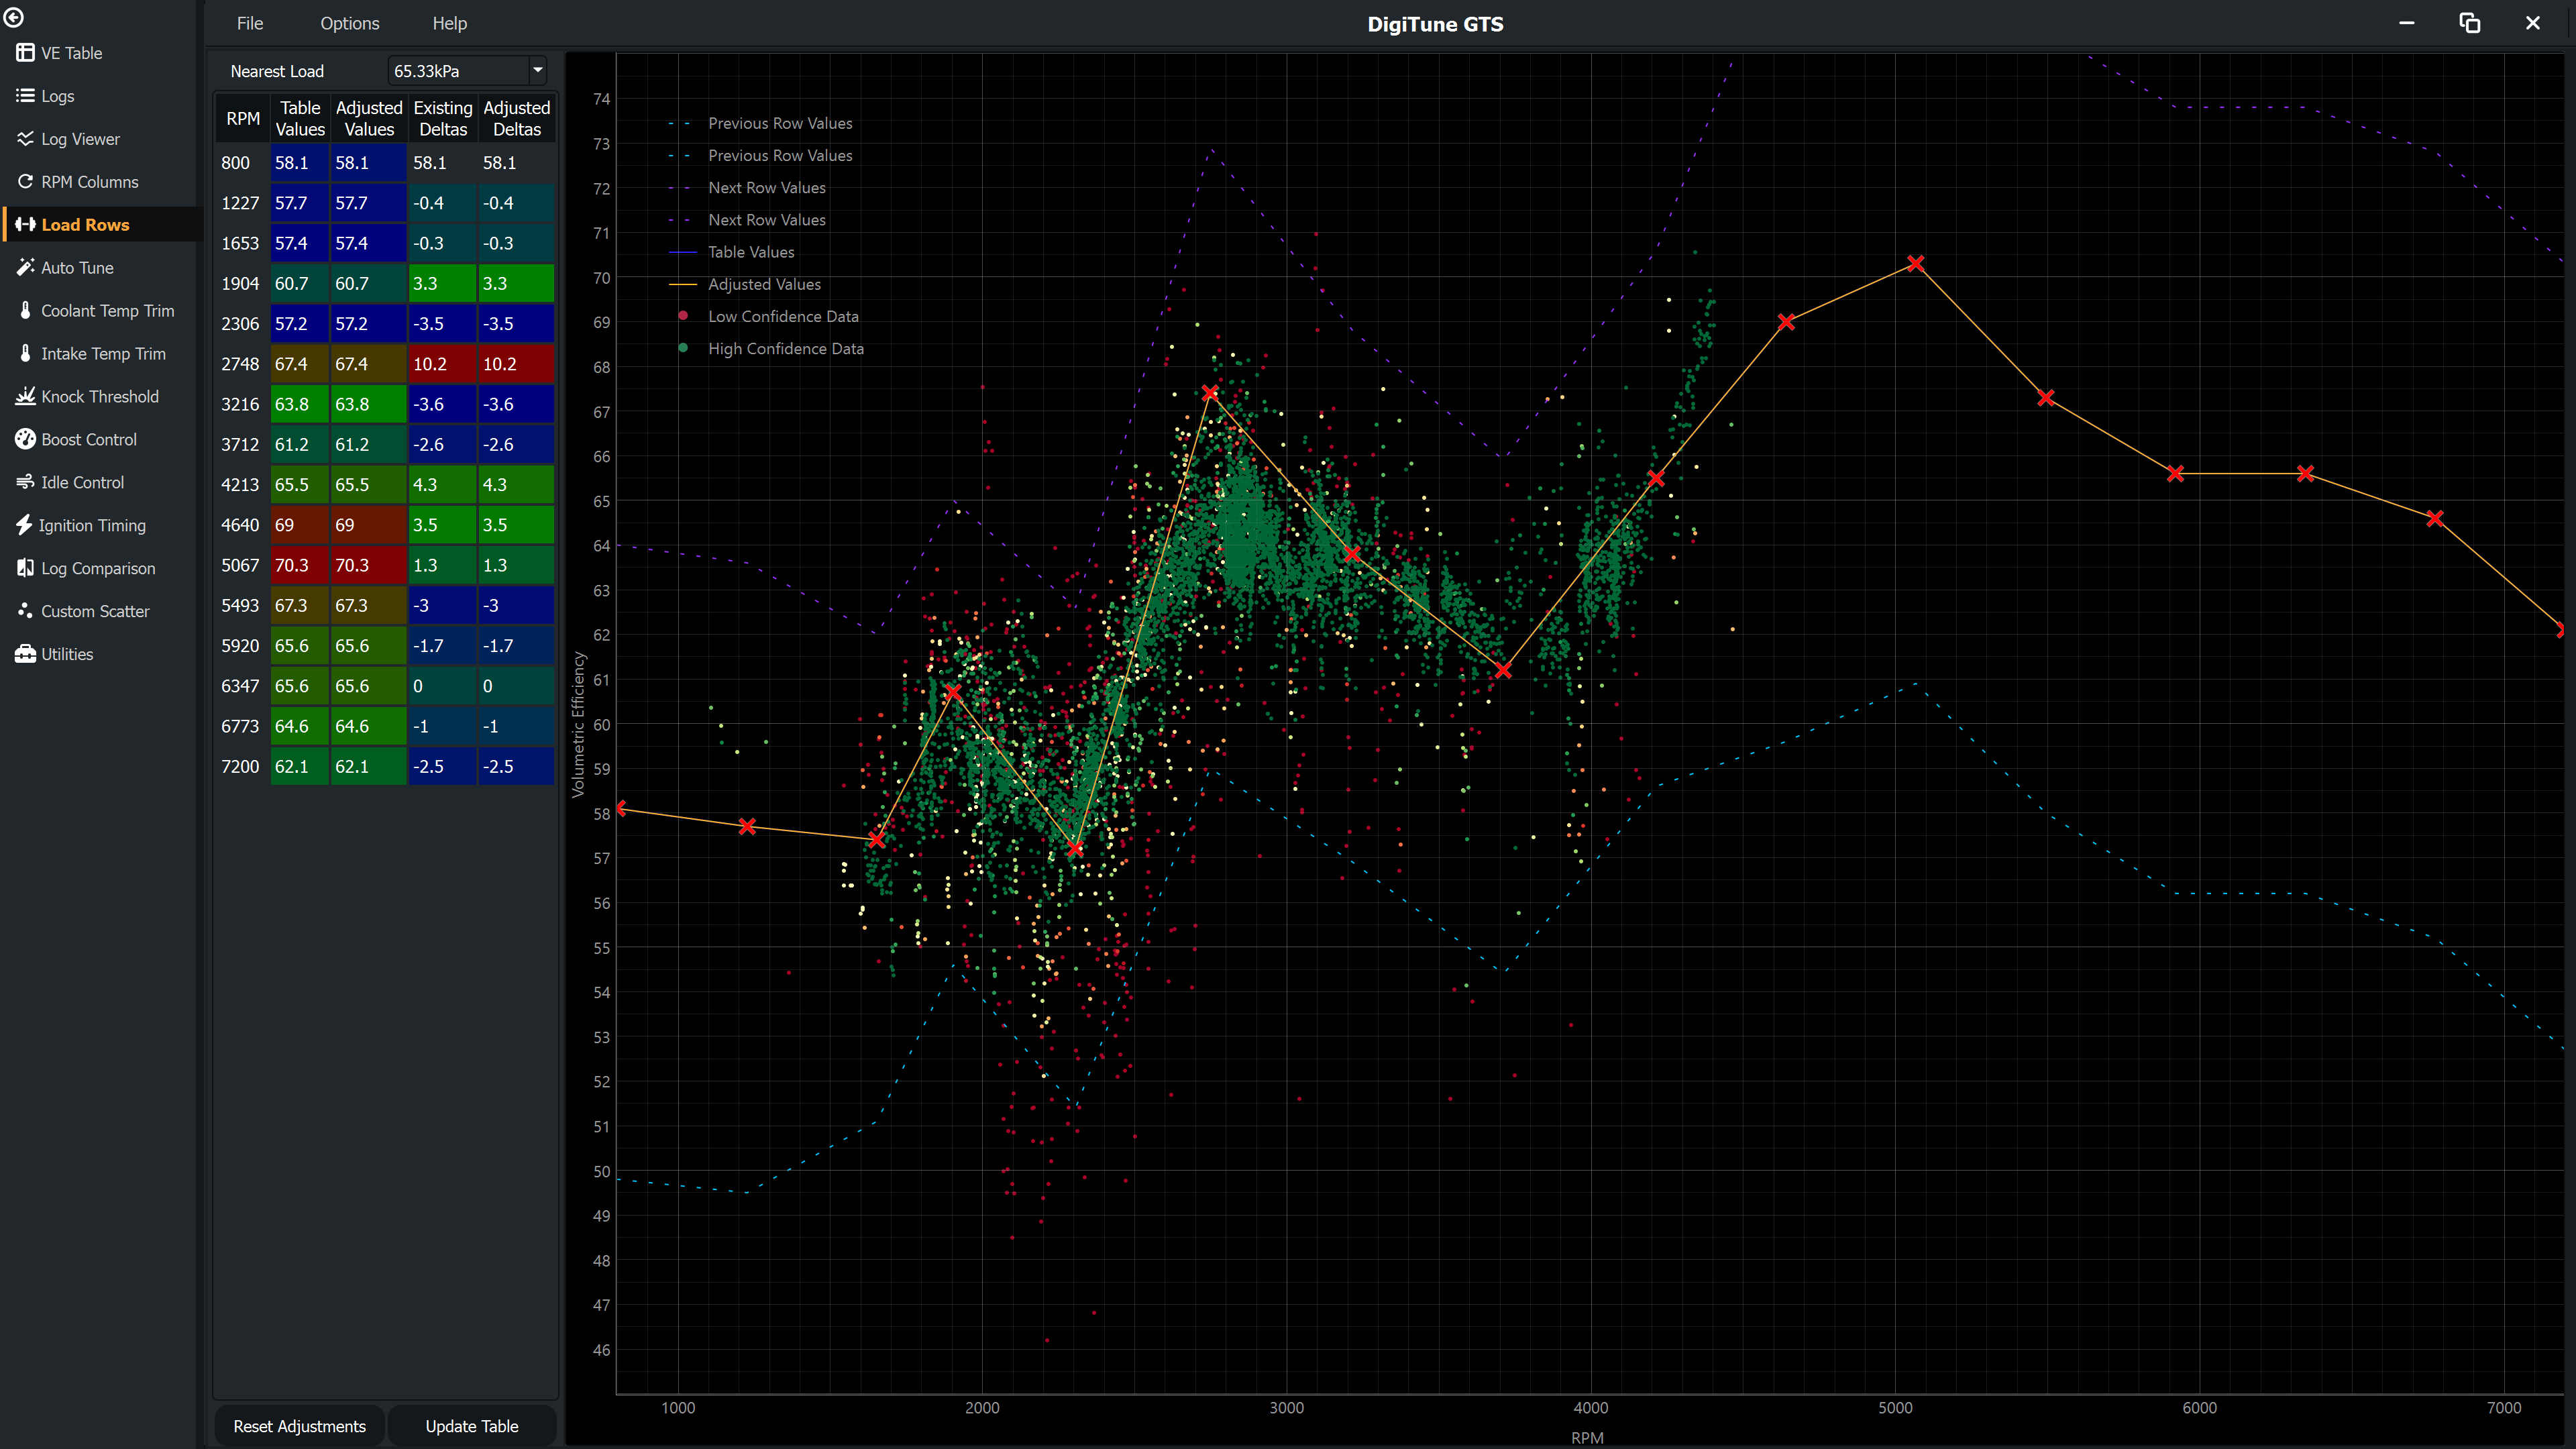
Identical in concept to the RPM Column page, but you select a Load breakpoint instead of an RPM breakpoint. The X axis of the graph becomes RPM. Use this page when you want to tune a specific load band across all RPM points — for example, adjusting the cruise load row.
Global Row and Global Column adjustments
These tools show the average required fuel correction across all RPM points (Global Row) or all Load points (Global Column). They are useful when you have a systematic lean or rich condition at a specific load or RPM band that needs to be corrected uniformly rather than cell by cell.
Both live on the Utilities page as separate tabs. The table shows a ratio representing how much each cell needs to change; clicking Update applies this ratio multiplicatively across the relevant row or column of the VE table.
Editing shortcuts
See Keyboard Shortcuts for the full list. Commonly used on tuning pages:
| Action | Shortcut |
|---|---|
| Increment selected cells | Shift + increment key |
| Decrement selected cells | Decrement key |
| Interpolate vertically | Select top & bottom cells, use interpolate hotkey |
| Interpolate horizontally | Select left & right cells, use interpolate hotkey |
| Set cells to a value | Select cells, use set-value hotkey |
| Copy selection | Ctrl+C |
| Paste | Ctrl+V |
| Update table | Update hotkey |
| Reset adjustments | Reset hotkey |
Log Comparison page
The Log Comparison page lets you overlay fuel data from multiple individual log files at a single Load or RPM value. Each log is shown in a different colour, making it easy to spot inconsistencies between tuning sessions. See Log Comparison for details.