Settings Reference
All tuning algorithm parameters with defaults and explanations
Settings are accessible from the menu bar via Options → App Settings.
They are persisted automatically to
%LOCALAPPDATA%\DigiTune\GTS\app_settings.json.
Click Reset Settings at the bottom of the page to restore all values to
factory defaults. Settings are grouped into tabs — each section below maps to one of those
tabs.
General
| Setting | Default | Description |
|---|
| Automatically Check for Updates | On |
Check for a new version of DigiTune GTS on startup. You can also trigger a manual check from Help → Check for Updates. |
| Analyse ECU Logs While They Record | On |
While the Live Data tab is capturing from a connected Motorsport Electronics ECU, the samples are fed into the app every few seconds, so the VE, ignition and boost pages fill in as you drive instead of only once you stop. The newest few seconds are held back until there is enough data around them to judge, so a reading never appears and then vanishes. Untick to analyse the capture in one go when it stops — the recording itself, and the .dth5 file it writes, are identical either way. |
| Prompt About Unapplied Changes on Save | On |
When you save the map with adjusted values that haven't been written to the table yet, show a prompt asking whether to apply them first. |
| Disable Multi-threading (Crash Workaround) | Off |
Run all log loading and processing on the main thread. The UI will freeze during loads, but this avoids a class of crash seen on some Windows machines. Only enable if DigiTune crashes when loading a log file. |
| Show Raw Sensor Channels in Volts | Off |
Some ECUs (Motorsport Electronics) log an analog sensor's pre-calibration raw reading as ADC counts (0–65535) rather than volts. Tick this to show those channels as the 0–5 V input voltage everywhere instead — Log Viewer, Custom Scatter, TPS Calibration and the sensor Cal Correction tabs. It is a display change only: your log data, the calibration tables and everything written back into your map stay in the ECU's own units. ECUs that already log raw volts (rusEFI, ECUMaster EMU PRO) are unaffected. |
| CSV Parser | Standard |
Which engine to use for reading CSV log files. Standard is the reliable default. Arrow is typically 2–3× faster on large logs but has been observed to crash on some machines. Switch to Arrow if you want faster log loading and aren't seeing crashes. |
Log Viewer
| Setting | Default | Description |
|---|
| Time Axis Display | HH:MM:SS since log start |
How the log viewer formats time. Elapsed seconds, HH:MM:SS since log start, or Wall clock (absolute time parsed from the log filename or file modification time). |
| Downsampling Mode | None |
How dense channels are reduced to screen pixels. None is lossless (slow on million-sample logs), min/max preserves spikes, mean smooths noise, subsample is fastest but can miss narrow spikes. |
| Hide Intermediate Time Axes | On |
When multiple subplots are stacked, hide the time axis on every subplot except the bottom-most one. Reclaims axis-row pixels so the plot areas are larger. |
| Subplot Gridlines | Both |
Which gridlines to draw on the overview and subplot stack: both, vertical only, horizontal only, or none. |
| Create JSON Sidecar for Markers | Off |
When enabled, markers placed on logs other than .dth5 are saved alongside the log as a <log>.markers.json file. .dth5 logs always persist markers inside the file itself. |
Data quality & validity
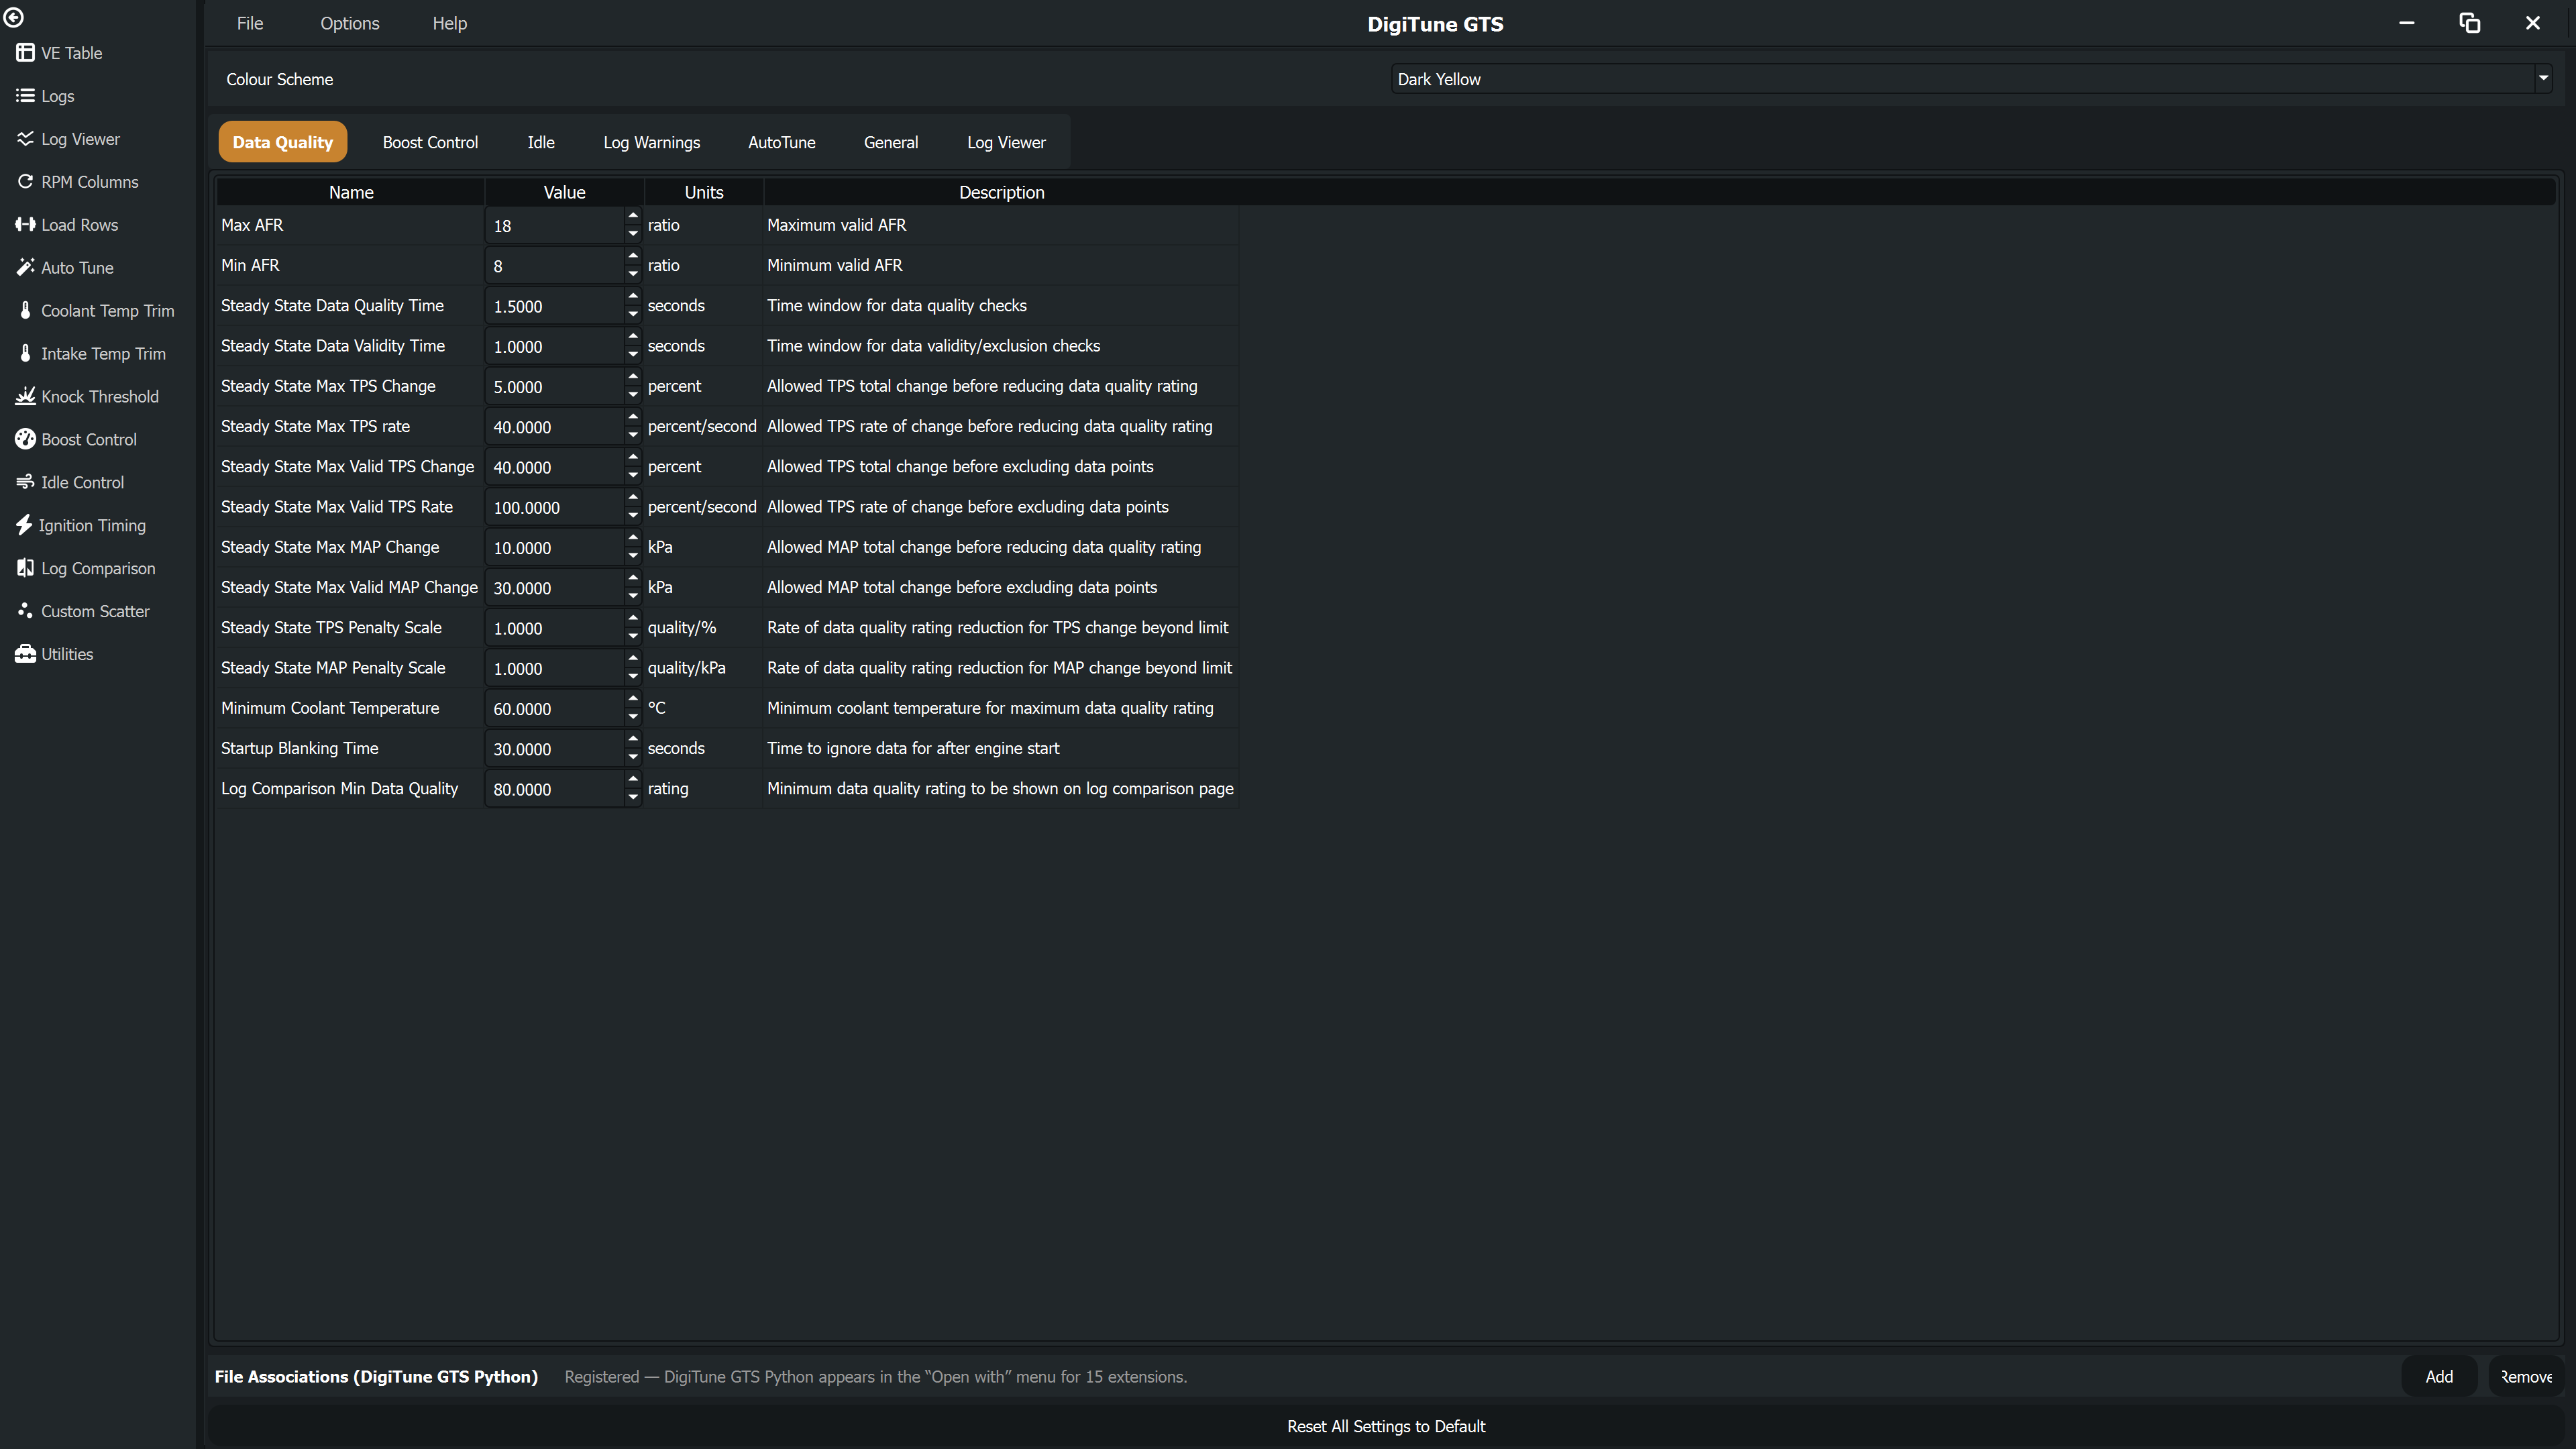
These settings control how DigiTune GTS scores each data point's quality. Only high-quality
(steady-state) data is used to calculate tuning corrections.
| Setting | Default | Units | Description |
|---|
| Max AFR | 18 | ratio |
AFR readings above this value are discarded as invalid (e.g. deceleration enleanment or sensor dropout). |
| Min AFR | 8 | ratio |
AFR readings below this value are discarded as invalid. |
| Steady State Data Quality Time | 1.5 | s |
Window over which throttle and MAP movement are assessed for quality scoring. Longer windows demand more sustained steadiness. |
| Steady State Data Validity Time | 1.0 | s |
Window used to determine whether a data point should be excluded entirely (as opposed to just penalised). Shorter than the quality time. |
| Steady State Max TPS Change | 5.0 | % |
Maximum TPS change within the quality window before quality starts to degrade. |
| Steady State Max TPS Rate | 40.0 | %/s |
Maximum TPS movement rate before quality starts to degrade. |
| Steady State Max Valid TPS Change | 40.0 | % |
TPS change above which the data point is excluded entirely regardless of quality. |
| Steady State Max Valid TPS Rate | 100.0 | %/s |
TPS rate above which the data point is excluded entirely. |
| Steady State Max MAP Change | 10.0 | kPa |
Maximum MAP change within the quality window before quality starts to degrade. |
| Steady State Max Valid MAP Change | 30.0 | kPa |
MAP change above which the data point is excluded entirely. |
| Steady State TPS Penalty Scale | 1.0 | quality/% |
How much quality degrades per percent of TPS movement above the threshold. |
| Steady State MAP Penalty Scale | 1.0 | quality/kPa |
How much quality degrades per kPa of MAP movement above the threshold. |
| Minimum Coolant Temperature | 60.0 | °C |
Below this CLT, data quality is reduced. Data from a cold engine is less representative of normal operation. |
| Startup Blanking Time | 30.0 | s |
Data collected within this time of engine start is ignored entirely. Post-start enrichment and sensor warm-up artefacts are excluded. |
| Overboost Recovery Blanking Time | 2.0 | s |
When an overboost protection event is detected (see the Log Health Check), data during the event and for this long afterwards is excluded — AFR, knock and boost readings are all corrupted by the ignition/fuel cut while boost recovers. |
| Rev Limiter Recovery Blanking Time | 1.0 | s |
When a rev-limiter, launch (2-step) or flat-shift cut is detected (see the Log Health Check), data during the cut and for this long afterwards is excluded — the ignition/injection cut misfires combustion, so AFR, knock and VE readings are meaningless until it recovers. |
Boost control tuning
| Setting | Default | Units | Description |
|---|
| Boost Control Minimum TPS | 80.0 | % |
Only data above this throttle position is used on the Boost page. Ensures only full-throttle runs are analysed. |
| Boost Control Full Throttle Req. Time | 1.0 | s |
The throttle must remain above the minimum TPS for this long before data is included. |
| Boost Control Response Rate | 1.0 | kPa/% |
Expected MAP change per unit of solenoid duty cycle. Used to estimate how much to change the duty to hit the boost target. Adjust to match your specific turbo and wastegate combination. |
| Boost Control Maximum Error | 30.0 | kPa |
Data points where achieved boost differs from target by more than this amount are excluded as outliers. |
| 100% Duty Boost Multiplier | 2.5 | × |
The ratio of boost expected at 100% duty vs 0% duty. Defines the shape of the duty-to-boost response curve used internally, and by the Boost page's Auto button. |
| Auto Set Conservatism | 75.0 | % |
Which slice of the turbo's response the Boost page's Auto fits to. One duty per RPM has to serve every gear, and a slow-climbing high gear makes more boost from the same duty. At 75 the row is set for the conditions that made more boost per duty than three quarters of the log, so the other gears run a little under target rather than over. |
| Auto Set Overshoot Tolerance | 5.0 | kPa |
Boost over target by more than this is an overshoot: such samples count even while the boost is still rising, and an RPM with a second or more of them is never raised. |
| Turbo Response Time | 0.5 | s |
How long the turbo takes to answer a change in solenoid duty. Each sample is credited to the duty the solenoid held over this much preceding time, and to the RPM the engine was at then. |
| Auto Set Settle Rate | 25.0 | kPa/s |
Boost still rising or falling faster than this has not settled. A sample below target only counts once the boost has settled. |
| Auto Set Max Raise | 20.0 | % |
The most Auto may raise any one point of the duty row in a single pass. Lowering is not capped. Measured over 642 client adjustments, 20 lands closest to what the tuner wrote next. |
| Auto Set Smoothing | 50.0 | % |
How strongly the suggested duty row resists kinks between adjacent RPM breakpoints. It smooths the correction, never the row. |
| Auto Set Reach | 500 | RPM |
How far either side of the logged RPM Auto carries a correction before fading back to your own row. |
| Auto Set Min. Full Throttle Time | 3.0 | s |
Quality-weighted settled full-throttle time at an RPM breakpoint before Auto trusts it fully. |
Idle control tuning
| Setting | Default | Units | Description |
|---|
| Idle RPM Response Rate | 20.0 | RPM/% |
Expected RPM change per percent of idle duty cycle. Used to estimate corrections on the Idle page. |
| Idle Averaging Filter Time | 2.0 | s |
Time window used to smooth duty cycle readings before they are included in the analysis. |
| Idle Settling Time | 5.0 | s |
Time the idle controller must have been active before data is considered valid. Allows closed-loop control to stabilise before sampling. |
| Idle Req. Time for Valid | 5.0 | s |
Minimum consecutive stable idle time required before a data point is included. |
| Expected RPM Variation | 20.0 | RPM |
Average idle RPM wander across the settling window treated as normal. A healthy closed-loop idle wanders — that is the controller working, not a fault. |
| Expected MAP Variation | 3.0 | kPa |
Average idle MAP variation across the settling window treated as normal. |
| Expected Duty Variation | 1.5 | % |
Average idle valve movement across the settling window treated as normal. The idle PID is never completely still. |
| RPM Variation Penalty | 1.5 | points/RPM |
Quality points removed per RPM of average wander beyond the expected variation. |
| MAP Variation Penalty | 1.0 | points/kPa |
Quality points removed per kPa of average variation beyond the expected variation. |
| Duty Variation Penalty | 5.0 | points/% |
Quality points removed per percent of average valve movement beyond the expected variation. |
| Allowed RPM Error | 50.0 | RPM |
Deviation from target idle RPM before quality is reduced. Sitting off target is the measurement rather than a fault — the required-duty calculation backs it out — so this exists to catch the point where that correction saturates. |
| Auto Set Smoothing | 50.0 | % |
How strongly the suggested idle duty curve resists kinks between adjacent temperatures. It smooths the correction, never your curve. |
| Auto Set Min. Idle Time | 5.0 | s |
Idle time recorded at a temperature before Auto trusts it fully. Below this the suggestion is held proportionally closer to the value already in the table. |
| Auto Set Reach | 15.0 | °C |
How far either side of the logged temperatures a correction carries before fading back to your own curve. |
| Auto Set Max Change | 0.0 | % |
The most Auto may move any one point of the idle duty curve. 0 means no limit, which is the default: Auto only suggests a curve for you to read before applying it, and a limit does not make a wrong suggestion right. The curve is always held inside the idle valve's own PWM Min/Max Duty range. |
| Auto Set Exit Duty Margin | 5.0 | % |
How far above the warm (90 °C) idle duty Auto sets Idle Settings > Exit Idle Duty when you apply a suggested curve. That setting describes the same valve as the duty curve, so a retuned curve leaves it wrong. 0 leaves it alone. |
| Auto Set Edge Carry | 100.0 | % |
How much of the correction at the edge of your logged temperature range is carried outward past it. 100 continues your own curve shape, offset to meet the fit; 0 returns to the values already in the table, which leaves a step at the edge of the data. |
| Auto Set Curve Smoothing | 50.0 | % |
How strongly the finished curve is smoothed before you see it. Auto Set Smoothing smooths the correction; this smooths the result, which is what removes the kinks left where half the axis moved and half did not. Breakpoints your log measured resist it. |
AutoTune algorithm
These are advanced parameters. The Smoothing and Fit Emphasis
sliders on the AutoTune page are the primary controls — adjust
these settings only if the sliders alone are insufficient.
| Setting | Default | Description |
|---|
| AutoTune Gradient Smoothness Factor | 20.0 |
Weight applied to the gradient smoothness penalty during optimisation. Higher values produce smoother tables by penalising large differences between adjacent cells more strongly. |
| AutoTune Shape Commonality Factor | 20.0 |
Weight applied to the shape consistency penalty. Higher values encourage the result to maintain a consistent load-shape across all RPM columns. |
| AutoTune Load Weighting Offset | 30.0 |
Bias applied to load-axis weighting. Higher values reduce the relative influence of low-load data points, giving more weight to mid-to-high load corrections. |
Knock
These control the Auto button on the
Knock page, which suggests knock thresholds from the
background noise level measured in your logs.
| Setting | Default | Units | Description |
|---|
| Auto Threshold Margin | 20.0 | % | How far above the measured background-noise ceiling the suggested threshold is placed, to allow for random noise variation between runs. Raise it if you see false knock events; lower it for more sensitivity. |
| Auto Threshold Min Samples | 20 | samples | Minimum valid log samples an RPM breakpoint needs before its noise ceiling is estimated. Breakpoints with fewer samples are interpolated from their neighbours instead. |
| Auto Threshold Smoothing | 40.0 | % | How strongly the suggested curve is smoothed to remove bin-to-bin sampling jitter; 0 turns it off. Smoothing only ever spends the margin — a value is never pulled below the noise actually measured at that RPM. |
| Auto Threshold Curve Smoothing | 30.0 | % | A spline fitted through the finished curve, which takes out the bends the setting above cannot see: it compares each breakpoint with its two neighbours only, so it cannot tell that the run of breakpoints it is comparing against is itself bent. Breakpoints your log measured resist it; interpolated and extrapolated ones give way first. Like the smoothing above, it only ever spends the margin. |
Log warnings
DigiTune GTS scans your logs for potential issues on load. These settings control the
thresholds used for each warning type.
| Setting | Default | Units | Description |
|---|
| Warn: Max Coolant Temp | 100.0 | °C | Coolant temperature above which an overheating warning is raised. At most one warning per 5 minutes of log, quoting that stretch's hottest reading and the time actually spent over the limit. |
| Warn: CLT Duration | 2.0 | s | Continuous duration above Max Coolant Temp required before a stretch counts at all. Stretches inside the same 5-minute period are then reported together — an engine sitting on the limit crosses it constantly, and a fan cycling is one overheat, not a dozen. |
| Warn: Max Battery Voltage | 16.0 | V | Battery voltage above this value triggers an overcharging warning. |
| Warn: Min Battery Voltage | 12.5 | V | Battery voltage below this value triggers an undercharging warning. |
| Warn: Battery Voltage Instability | 0.5 | V (std dev) | Standard deviation of battery voltage, over a 3-second window, above which instability is flagged. A change of charging target is excluded rather than measured away: on an ME the alternator controller says when it moves its own target, and on a car without one the regulator coming on line — not charging before, charging after — is recognised from the trace. Everything that returns (a sag, a dip, a spike, an oscillation) is still reported, and so is a step the other way. |
| Warn: Undercharge Time Proportion | 0.02 | fraction | Proportion of total log time spent below Min Battery Voltage required to trigger the warning. Prevents false alarms from brief dips. |
| Warn: AFR Sensor Failure Threshold | 17.0 | ratio | AFR above this value, at open throttle and with the injectors firing, is examined. What it is called then depends on the evidence: a reading that does not move while the engine does is reported as a sensor fault, one that tracks is reported as a lean mixture if the engine was pulling (at or above 80 kPa), and a lean reading at light load or on a trailing throttle is not reported at all. |
| Warn: AFR Sensor Failure Min TPS | 5.0 | % | Minimum TPS for the AFR check to be active. Two kinds of sample are excluded regardless: those where the ECU has cut the fuel (overrun), because the exhaust is full of air and the reading means nothing about the mixture; and those where the wideband controller is still warming up, which it signals by parking its output below 0.5 V — an AEM X-Series shows 8.5 AFR there, and it is not a measurement. |
| Warn: AFR Sensor Failure Duration | 3.0 | s | Continuous duration of high AFR at open throttle required before the stretch is counted. However many stretches a log contains, the result is one warning: a dead sensor and a lean tune are each one condition, not one finding per stretch. Whether the wideband has failed is decided separately, by whether the reading moves after the throttle does — a failed sensor can still drift over a fraction of an AFR, so nothing about the shape of the trace on its own answers it. |
| Warn: Lost Sync Min RPM | 500.0 | RPM | Lost sync events are only reported if they occurred above this RPM. Events at low RPM (cranking) are ignored. |
| Warn: Noisy TPS Reversal Rate | 4.0 | per second | TPS direction changes per second above which the movement is treated as signal noise rather than driver input. A sharp throttle tap is one reversal; a rattling sensor reverses on almost every sample. |
| Warn: Noisy TPS Time Proportion | 0.02 | fraction | Proportion of running time showing noisy TPS movement required before the warning is raised. |
| Warn: Knock Rev Limit Fallback | 7000.0 | RPM | Assumed hard-cut RPM used to suppress knock warnings near the limiter when the log has no rev-limit channel (MegaSquirt, ECUMaster, MaxxECU). |
Live warnings
The spoken warnings that beep and speak while a capture or a
live readout is running. These four are the global switches; which warnings are on, and
what each one's limit is, is set from Choose warnings… on the Live Data tab,
because it is a list rather than a handful of numbers.
Four of those limits are the log-warning thresholds above — Max Coolant Temp, Min and Max
Battery Voltage, and the AFR Sensor Failure Threshold. They are deliberately the same numbers,
so changing one in either place changes it in both: it is one statement about one engine.
| Setting | Default | Units | Description |
|---|
| Spoken Warnings While Logging | On | — | The master switch. Also on the Live Data tab, beside the Start buttons, so it can be reached with an engine running. |
| Speak the Warning | On | — | Say the warning aloud after the beep, using a Windows offline voice. Off means beep only — which is also what you get automatically if the machine has no voice installed. |
| Beep Before Speaking | On | — | Play an attention tone in front of each warning: one tone for a warning, a higher one for anything critical. It also covers the speech engine's own start-up delay, so turning it off makes the words arrive about a fifth of a second later. |
| Warning Volume | 100.0 | % | How loud the spoken warning is, as a percentage of the system volume. |
Log comparison
| Setting | Default | Units | Description |
|---|
| Log Comparison Min Data Quality | 80.0 | quality score |
Only data points above this quality score are shown on the Log Comparison page. Reduces visual noise from transient data. |