Home Page
Your configurable dashboard — a 2×2 grid of live tuning previews
The Home page is the first screen you see when DigiTune GTS opens, and you can return to it any time with the Home button at the top of the sidebar. It shows a 2×2 grid of preview tiles, each giving an at-a-glance, read-only snapshot of one tuning view. Once you've loaded a map and one or more logs, the dashboard lets you spot the overall state of your tune — fuel error, boost, knock — without clicking through every page.
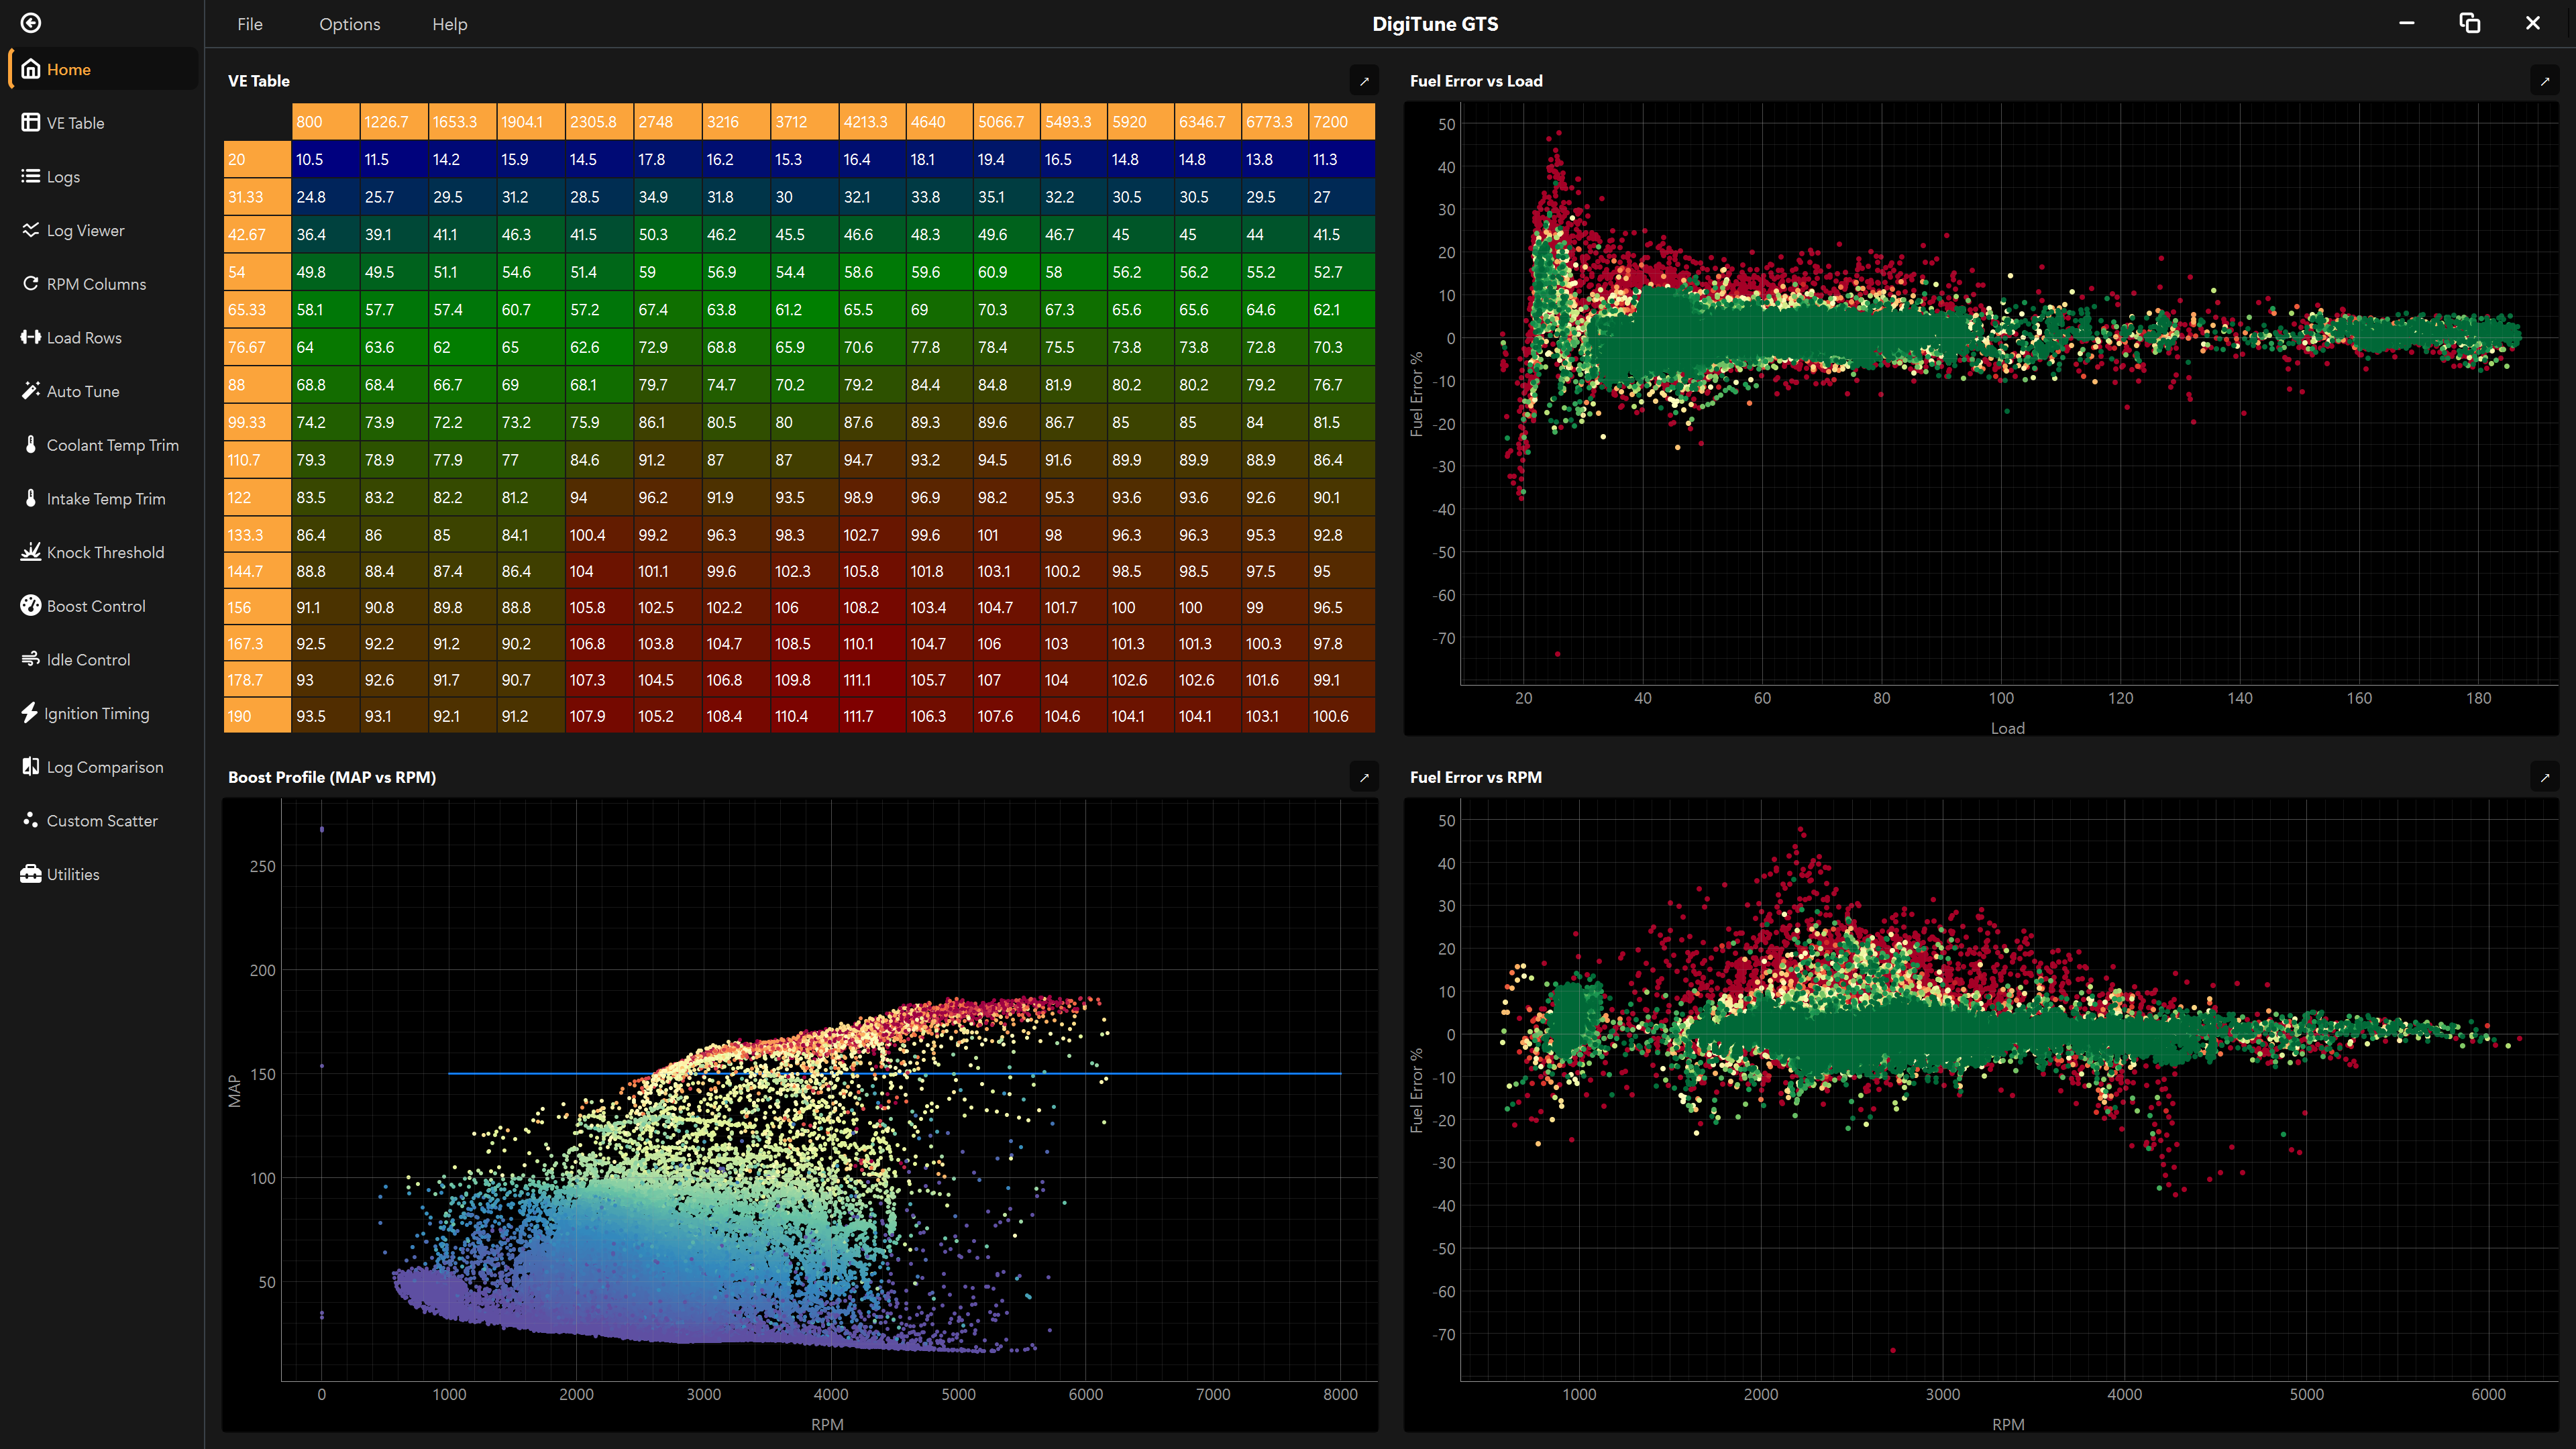
The four tiles
Out of the box the quadrants are arranged like this. You can change any tile to a different view (see Customising the layout below).
| Position | Default view | What it shows |
|---|---|---|
| Top-left | VE Table | The current fuel/VE table as a heat-map-coloured grid. |
| Top-right | Fuel Error vs Load | Measured fuel error (%) plotted against engine load. |
| Bottom-left | Boost Profile (MAP vs RPM) | Logged manifold pressure against RPM, with the closed-loop boost target line. |
| Bottom-right | Fuel Error vs RPM | Measured fuel error (%) plotted against RPM. |
Opening the full page
Every tile is a shortcut to the page it previews. To jump straight to the full, editable version:
- Left-click anywhere on the tile, or
- click the ↗ (open) button in the tile's top-right corner.
The click target is fixed per view, so the destination always matches what you're looking at:
| View | Opens |
|---|---|
| VE Table | VE Table page |
| Fuel Error vs Load | Global Row Trims (Utilities tab) |
| Fuel Error vs RPM | Global Column Trims (Utilities tab) |
| Boost Profile / Boost Open-Loop Table | Boost page |
| Ignition Timing | Ignition Timing page |
| Knock vs RPM | Knock Threshold page |
Customising the layout
Right-click any tile to choose which view fills that quadrant. The menu groups the available views under Tables and Plots:
- Tables: VE Table, Boost Open-Loop Table, Ignition Timing
- Plots: Boost Profile (MAP vs RPM), Fuel Error vs Load, Fuel Error vs RPM, Knock vs RPM
A tick marks the view currently shown in that quadrant, and the factory default for the quadrant is labelled (default). Choose Reset to default at the bottom of the menu to put the quadrant back to its original view.
Your choices are saved automatically and restored the next time you launch the application — each of the four quadrants is remembered independently.
Typical workflow
- Load your map file and logs (see Loading Files).
- Open the Home page to review fuel error, boost and knock at a glance.
- Spot an area that needs attention — for example a band of large fuel error.
- Click that tile to jump straight to the page where you can adjust it.
- Return to the Home page; the previews update to show the effect of your change.